Database Reference
In-Depth Information
10
7
10
6
10
5
10
4
10
3
10
2
10
1
10
0
10
7
10
6
10
5
10
4
10
3
10
2
10
1
10
0
2003
2004
Slope=
−2.64
Slope=
−2.15
10
−9
10
−8
10
−7
10
−6
10
−5
10
−9
10
−8
10
−7
10
−6
10
−5
PageRank
PageRank
10
7
10
6
10
5
10
4
10
3
10
2
10
1
10
0
10
7
10
6
10
5
10
4
10
3
10
2
10
1
10
0
2005
2006
Slope=
−2.59
Slope=
−2.59
10
−9
10
−8
10
−7
10
−6
10
−5
10
−9
10
−8
10
−7
10
−6
10
−5
PageRank
PageRank
(a) PageRank of LinkedIn
10
5
10
4
10
3
10
2
10
1
10
0
10
5
10
4
10
3
10
2
10
1
10
0
Wikipedia 2005
Wikipedia 2006
Slope=
−2.44
Slope=
−2.51
10
−6
10
−5
10
−4
10
−3
10
−6
10
−5
10
−4
10
−3
PageRank
PageRank
10
5
10
4
10
3
10
2
10
1
10
0
Wikipedia 2007
Slope=
−2.63
10
−6
10
−5
10
−4
10
−3
PageRank
(b) PageRank of Wikipedia
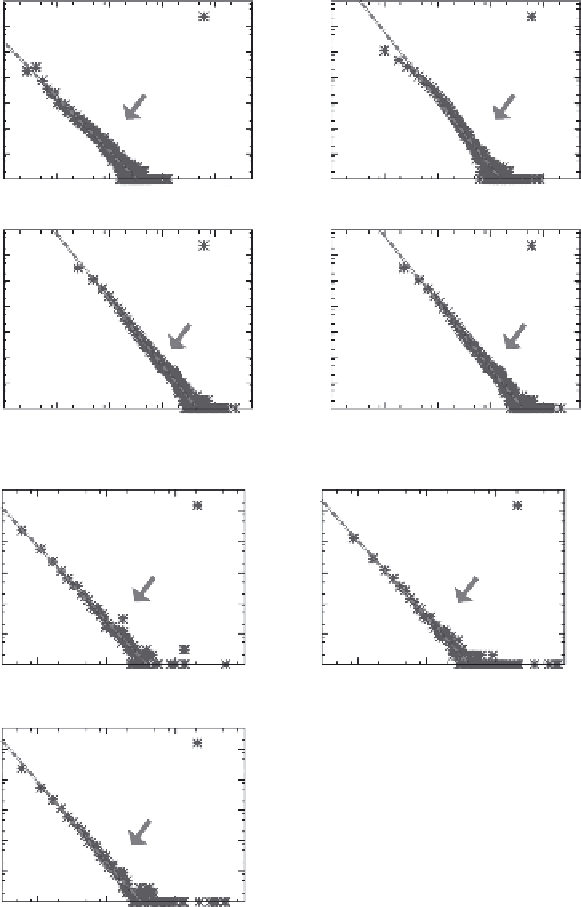
FIGURE 8.15
The evolution of PageRank. (a) The distributions of PageRank follows a power
law. However, the exponent at year 2003, which is around the gelling point, is much different
from year 2004, which are after the gelling point. The exponent increases after the gelling point
and becomes stable. Also, notice the maximum PageRank after the gelling point is about 10 times
larger than that before the gelling point due to the emergence of the giant connected component.
(b) Again, the distributions of PageRank follows a power law. Since the gelling point is before year
2005, the three plots show similar characteristics: the maximum PageRank and the slopes are similar.
Search WWH ::

Custom Search