Database Reference
In-Depth Information
(a)
10
6
10
5
10
4
10
3
10
2
10
1
10
0
10
6
10
5
10
4
10
3
10
2
10
1
10
0
2003
2004
Unstable
stop
Slope =
−2.75
Giant
connected
component
Giant
connected
component
10
0
10
1
10
2
10
3
10
4
10
5
10
6
10
7
10
0
10
1
10
2
10
3
10
4
10
5
10
6
10
7
Size
Size
10
6
10
5
10
4
10
3
10
2
10
1
10
0
10
6
10
5
10
4
10
3
10
2
10
1
10
0
2005
2006
Slope =
−2.75
Slope =
−2.75
Giant
connected
component
Giant
connected
component
10
0
10
1
10
2
10
3
10
4
10
5
10
6
10
7
10
0
10
1
10
2
10
3
10
4
10
5
10
6
10
7
Size
Size
(b)
10
5
10
4
10
3
10
2
10
1
10
0
10
5
10
4
10
3
10
2
10
1
10
0
2005.11
2006.09
Slope =
−4.75
Slope =
−4.75
Giant
connected
component
Giant
connected
component
10
0
10
1
10
2
10
3
10
4
10
5
10
6
10
7
10
0
10
1
10
2
10
3
10
4
10
5
10
6
10
7
Size
Size
10
5
10
4
10
3
10
2
10
1
10
0
2007.02
Slope =
−4.75
Giant
connected
component
10
0
10
1
10
2
10
3
10
4
10
5
10
6
10
7
Size
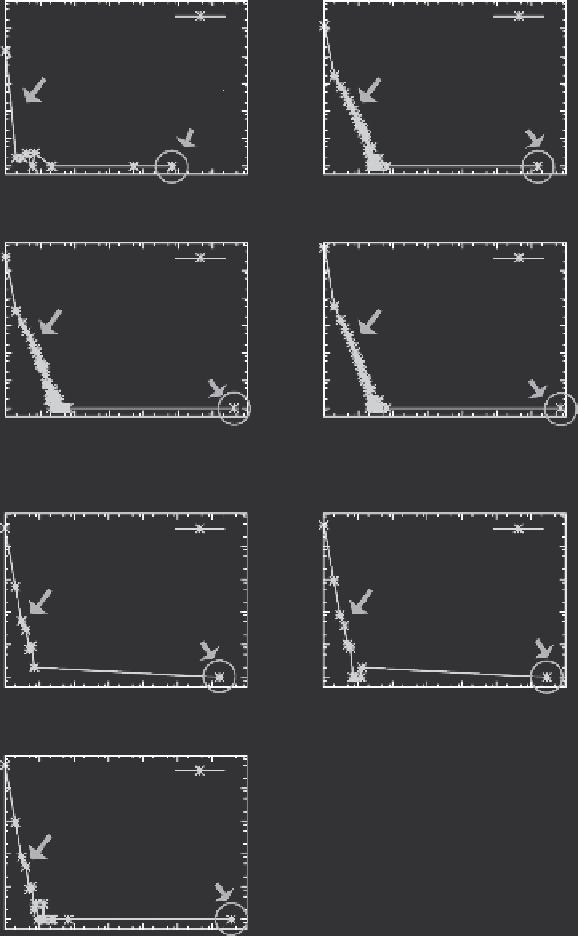
FIGURE 8.11
The evolution of connected components of (a) LinkedIn and (b) Wikipedia
graphs. The giant connected component grows each year. The second largest connected com-
ponents do not grow above Dunbar's number (≈150) and the slope of the size distribution
remains constant after the gelling point at year 2003. As in LinkedIn, notice the growth of
giant connected component and the constant slope of the size distribution.
Search WWH ::

Custom Search