Information Technology Reference
In-Depth Information
a
b
c
d
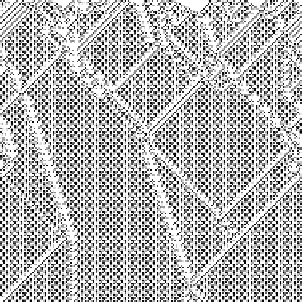
Fig.11.
Space-Time diagram and filtered diagram of rules:
(a)-(b)
φ
a
,
(c)-(d)
φ
c
.
It is shown a window of 256x256 points. Black represents a cell in state 1 while white
is a cell in state 0.
The corresponding filtered space-time diagram of Figure 11-a is shown in
Figure 11-b where cells in a domain are plotted in white. The filtered diagrams
reveal defect cells that interact among them and are transmitted from dis-
tant parts of the lattice until the synchronization of the whole system is obtained.
Figure 11-c shows a space-time diagram of rule
φ
c
. The domain for
φ
c
is not a regular pattern as it is for
φ
a
, but a chaotic pattern of triangles
of different sizes. To construct a filter for
φ
c
we left the rule to run for a
long time (10
5
time steps) and then we measure the frequencies of appear-
ance of spatial sequences of symbols of a given length ( we use words of 6
bits ). Then the sequences of symbols with small frequencies are considered
as defects. Figure 11-d shows the filtered diagram corresponding to Fig-