Information Technology Reference
In-Depth Information
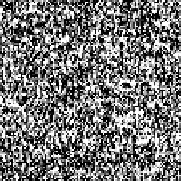
Fig.7.
Snapshots of rule
φ
a
running on a d=2 lattice size of 10
6
cells. Three consecutive
time steps are shown. Black cells correspond to state 1 and white cells to state 0.
Finally Figure 7 shows three consecutive snapshots of the evolution of rule
φ
a
.
The spatial structure is very homogeneous with some spot-like inhomogeneities
but there is not any propagating structures such as “gliders” observed in others
low-dimensional systems.
0.6
0.5
1
0.5
b
c
d
a
0.4
0.5
0.3
0.5
0.3
0.2
0
0.1
0.4
0.2
0.3
0.4
0.5
0
0.5
1
0.1
0.3
0.5
0.4
0.5
0.6
c(t)
0.5
1
0.5
0.6
c1
b1
d1
a1
0.4
0.4
0.5
0.3
0.5
0.3
0.2
0.2
0
0.1
0.4
0
500
1000
0
500
1000
0
500
1000
0
500
1000
t
Fig.8.
The iterative map and the corresponding time series of the concentration for
the best evolved rules in
d
=1
(a)
φ
a
.
(b)
φ
b
.
(c)
φ
c
.
(d)
φ
d
. Lattice size is 2000
cells. Transient of 1000 time steps.
3.2
Experiments in d=1
In
d
= 1 the GA is able to find many rules with the desired behavior, about
30% of the runs ended up with a rule that showed a P3 collective behavior.
Figure 8 shows the iterative map and the time series of the concentration for
some of the best evolved rules
φ
a
,φ
b
,φ
c
and
φ
d
.


