Information Technology Reference
In-Depth Information
three sets of weight values (Table 1). In other words, the temporal process can enable
us better understand the organized local growth. If we explore the changes of weight
values, it can be found that the major changes are indicated in major road and center.
As explained in section 2 (eq. 3 and 4), weight values should be the functions of tem-
poral development demand. Table 1 also shows the functions are highly complicated
in reality. A universal or standard function is not available. Rather it should be simpli-
fied and based on local knowledge. Model 2 actually is based on the interviews with
local planners.
Table 1.
Test of temporal heterogeneity (Zuankou)
Results
Model 1
Model 2
Total cells
1390
1390
Accuracy (CC)
55%
55%
Lee-Sallee Index
38%
38%
Stochastic
(α=10%)
1%
1%
Iteration number
50
50
Neighb. size
6
6
c
0.5
0.5
Temporal division
100%
<15%, 15%-50%, >50%
Major road (MR)
0.2
- 0.5 0.05
Minor road (OR)
0.3
- 0.1 0.15
Centers (CE)
-
0.7 - 0.5
Neighb. (new)
0.3
0.3 0.1 0.15
Master Planning
0.2
- 0.3 0.15
Total
100%
100% 100% 100%
Gradient for MR
0.0005
0.0005
Gradient for OR
0.002
0.002
Gradient for CE
-
0.0004
Note( "-" :0)
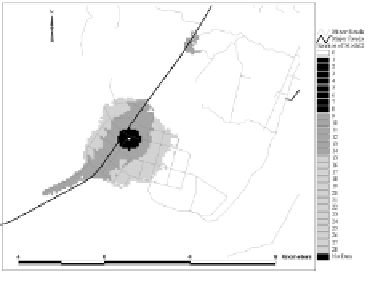
Fig. 2
. Test of temporal heterogeneity (Model 1 & Model 2)