Information Technology Reference
In-Depth Information
700
700
600
600
500
500
400
400
300
300
200
200
100
100
0
0
0
100
200
300
400
500
600
700
0
100
200
300
400
500
600
700
(a)
(b)
700
700
600
600
500
500
400
400
300
300
200
200
100
100
0
0
0
100
200
300
400
500
600
700
0
100
200
300
400
500
600
700
(c)
(d)
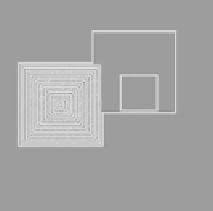
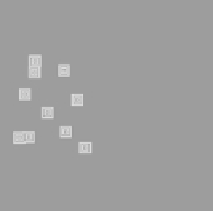
Fig. 7.
Four snapshots of the whole lattice (700 X 700) at different time steps in the trial
of Fig. 5 (
P
resp
3), simulated by the DTHI model. The dark grey, light grey, white and
black represent healthy, infected A1, infected A2 and dead cells respectively. Figures
(a) to (d) indicated time steps 300, 400, 500 and 600 respectively. The treatment starts
at 300 time steps.
4 Discussions and Conclusions
The main success of the present model is the adequate modelling of the four-
phases of HIV infection with different time scales into one model. Moreover, we
could also integrate all of the three different therapy procedures into one model.
The simulations show a qualitative correspondence to clinical data. During the
phase of drug therapy response, temporal fluctuations for
N>
3 were observed,
this is due to the relative simple form of the response distribution function
(
P
resp
) applied to the drug effectiveness parameter
N
at each time-step. Our
simulation results indicate that, in contrast to ODE/PDE, our model supports
a more flexible approach to mimic different therapies through the use of mapping
the parameter space of
P
resp
to clinical data.
P
resp
is different functions of time
step, corresponding to different therapies. In this paper, we employ different
constant
P
resp
over time step for mono-/combined therapy and linear
P
resp
over
time step for HAART therapy. Therefore there is ample room to incorporate