Information Technology Reference
In-Depth Information
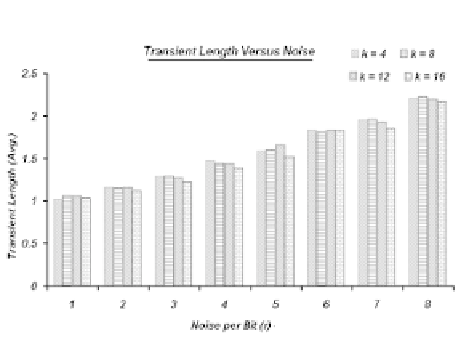
Fig. 7.
Graph of Transient Length versus Noise for
n
=50
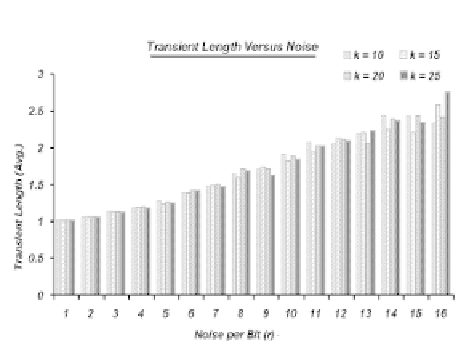
Fig. 8.
Graph of Transient Length versus Noise for
n
= 100
4.3 Identification/Recognition Complexity
The
Fig.7
and
8
represent time taken to recognize a noisy pattern for
n
=50
and
n
= 100 respectively. All the results reported in
Fig.7
and
8
ensure that
the time taken to recognize a noisy pattern is independent of
k
. Also, it does
not depend on the size of the patterns learnt (
n
). It depends on the transient
length of the
CA
, which is constant.
Hence, the cost of computation for
the entire recognition/identification process is constant.