Information Technology Reference
In-Depth Information
a)
North Sea
Koblenz
Moselle
Bernkastel−Kues
b)
c)
4/7
3/7
2/7
1/7
7/7
6/7
5/7
Fig. 1.
River Moselle example: a) map of part of the river, b) fragmentation by dams
and tributary rivers, c) representation as directed graph.
0
10000
20000
30000
40000
iterations
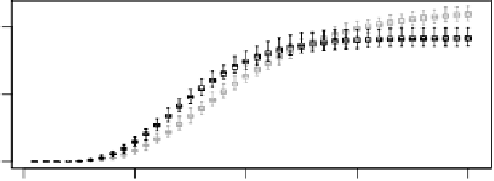
Fig. 2.
Numbers of fish arriving at river's headwaters. Simulation of upstream mi-
gration of 1000 fish with increasing permeabilities (grey) and equal permeabilities on
mainstream (black). Shown are box-and-whisker plots from 100 runs each.


