Information Technology Reference
In-Depth Information
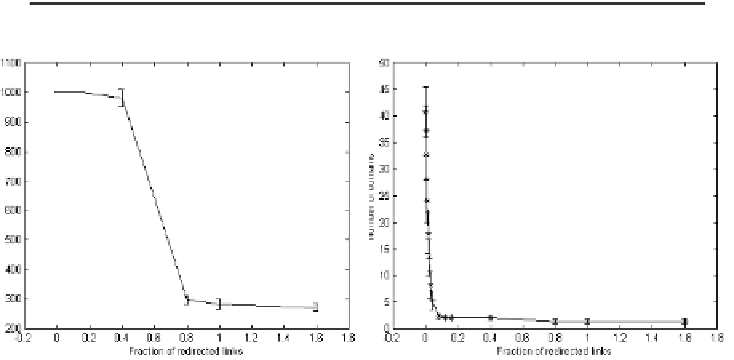
and the disordered case. Moreover, the average number of domains of this zone is
already close to the random graph value (fig.2).
Table 1.
Data about the dynamical properties of the systems at different degree of randomness f
(fraction of redirected links). Data concerning simulations performed on 10 networks of 1000
nodes with 1000 initial conditions each are shown. A
1000
Number of final states reached from
1000 random initial conditions. B
1000
number of initial conditions (out of 1000) which belong
to the largest basin of attraction. S
0
number of nodes (out of 1000) which always take the value
0 in the final state, in a given network. H
med
average Hamming distance between two different
0
min
and
0
max
are defined in the text
fixed points.
r=0.5
f=0
f=0.08
f=0.8
Average
St. Dev.
Average
St.Dev.
Average
St.Dev.
A
1000
1000
0
1000
0
298
14
B
1000
1
0
1
0
365
13
S
0
500
2
499
3
500
4
H
med
501
1.0
499.6
1.6
501
4.0
min
0.46
0.005
0.29
0.01
0.33
0.01
0
max
0.55
0.01
0.72
0.013
1
0
0
r=0.2
f=0
f=0.08
f=0.8
Average
St.Dev.
Average
St.Dev.
Average
St.Dev.
A
1000
196
176
37
58
1
0
B
1000
313
303
721
230
1000
0
S
0
955
24
966
10
1000
0
H
med
14
4
12
3
……
min
0.19
0.13
0.98
0.01
1
0
0
max
1
0
1
0
1
0
0
Fig. 2.
Majority rule: average number of attractors (left) and of homogeneous domains (right)
versus the fraction f of redirected links in the case r=1/2; Each point is the average of the values
obtained from 10 different networks; n=1000, 1000 different initial conditions for each net