Game Development Reference
In-Depth Information
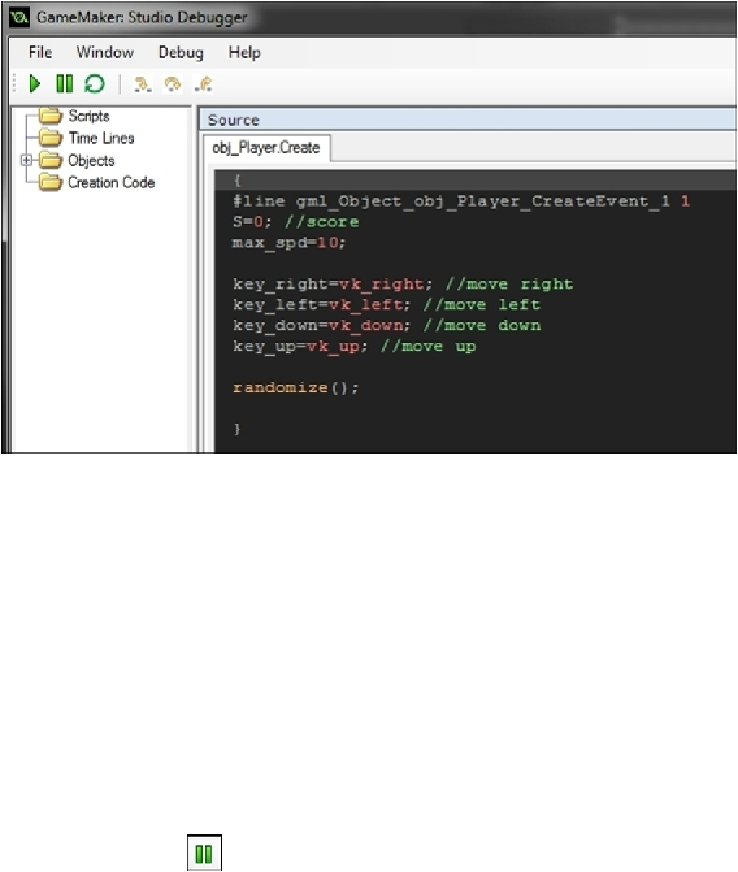
From this window, we can see all the source code for our game. To go to different sections
of code, use the tree structure on the left-hand side of the debugger window to select ob-
jects, events, or scripts you wish to see.
To add a break point, double-click on the line. A red dot should appear to the left of the
line when a break point is active. To remove the break point, double-click on the same line
again.
When the game reaches this line of code, it should automatically pause.
To see the code line by line, we need to start by pausing the game if it's not already paused
by a break point. Do this by clicking on the green pause symbol at the top-left corner of
the debugger window
.
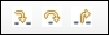
This will pause the game in its current step, and we can then use the step controls at the
top of the debugger window to control what the game does
.