Biomedical Engineering Reference
In-Depth Information
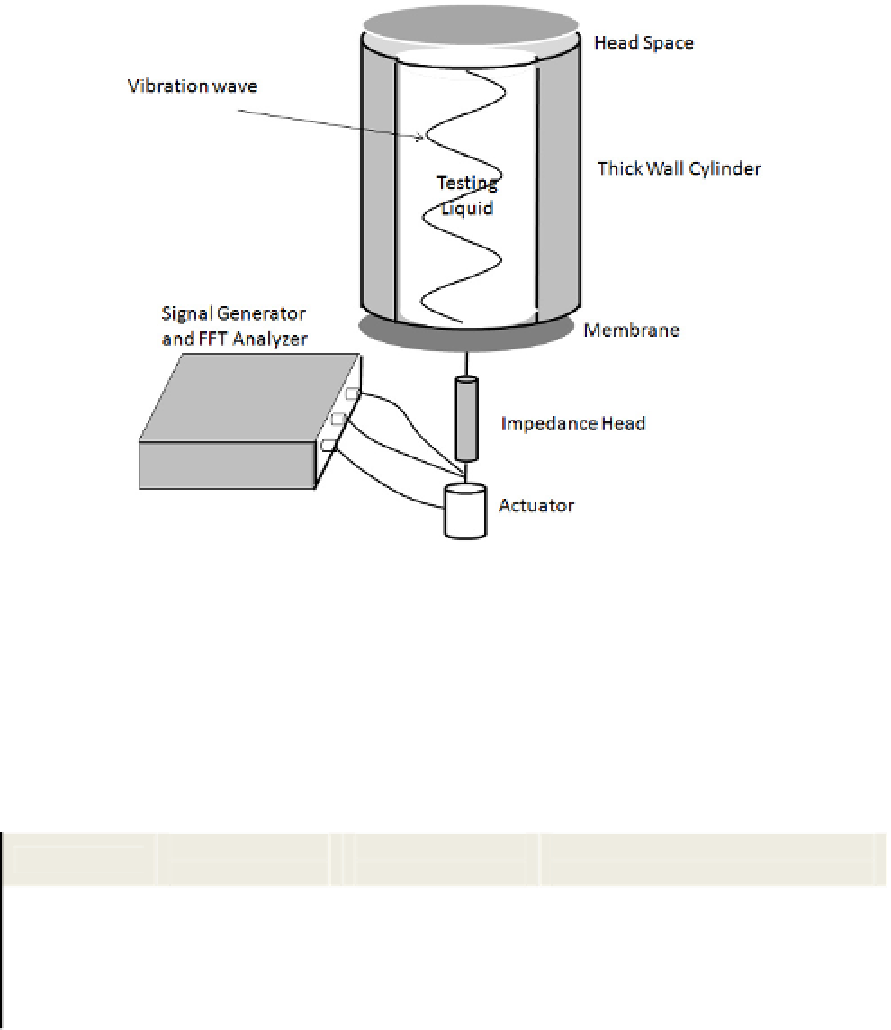
Fig. 1. Schematic of the apparatus to measure viscosity of liquids inside a thick wall rigid tube.
Further details of this experimental setting can be found elsewhere in Mert et al. (2004).
It has been hypothesized that plots of absolute mobility as a function of frequency should
exhibit peaks and valleys corresponding to the resonance and anti-resonance frequencies of
the standing waves from which the rheological properties of the liquid, notably its viscosity,
can be obtained. To validate the theory described above, liquids with known physical
properties including viscosity, density and sound velocity though them (the latter measured
by a pulse-echo ultrasound method) were tested. Table 1 list viscosity of the liquids (liquids
1 to 4) used for this test along with their relevant physical properties.
Intrinsic sound velocity
m/s
1 17 800 1246
2 96 971 1010
3 990 969 967
4 4900 963 943
5 10,050 980 -
Table 1. Physical properties of the liquids used to validate theory; properties are at 25
o
C.
Viscosity
mPa . s
Density
kg/m
3
Liquid
Figure 2 illustrates measured magnitude of the mechanical impedances Abs (1/Z
a0
) liquids
2, 3, and 4 (see Table 1). It is clearly shown in the figure the effect of the liquid viscosity on
the measured impedance, in general the higher is the viscosity of the liquid the lower is the
value of the magnitude of the mechanical impedance at the peak/resonance frequency. The
resonance frequency (frequency where peaks in impedance are obtained) is also affected by
the viscosity of the liquid and tend to decrease when the viscosity of the liquid increases,
which would be indicating a decrease in the sound velocity though the liquid. The latter in