Biomedical Engineering Reference
In-Depth Information
Figure 11 illustrates a specific example of how to detect the various phosphate groups in
terms of Q
n
(isolated or connected phosphates) by IR spectroscopy. We reported at the
bottom of the graph the P2.5 IR spectrum of the phosphates computed applying the
aforementioned procedure (fragment mode). The three bar charts refer each one to the Q
n
species present inside the structure and show only the frequencies involving that specific
class of phosphate groups (isolated or connected to the network). It is interesting to note the
shift of the highest and lowest bands comparing Q
1
and Q
2
cases: the highest frequency -
indicated with the label
h
- corresponds to the stretching of the P=O bond and is shifted to
higher values in case of Q
2
, with respect to Q
1
and Q
0
. On the contrary, in the region of low
frequencies, modes involving the Q
2
species are shifted to lower values compared to the Q
1
ones. The OPO bending region (600-700 cm
-1
) remains almost unaffected.
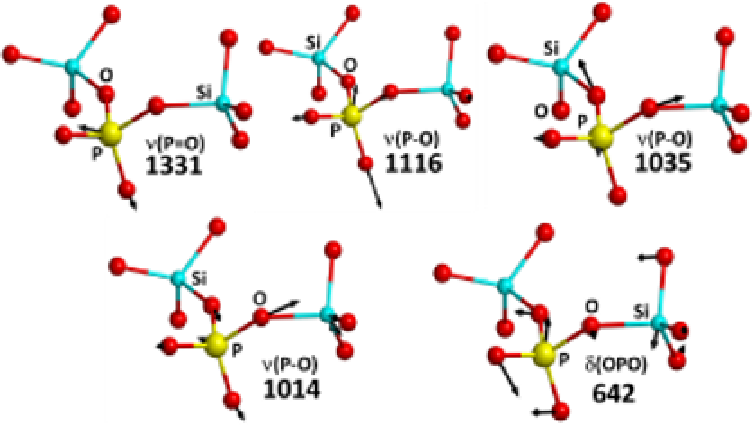
Figure 12 illustrates the graphical representation of the normal modes displacement for the
five stretching and bending modes of the Q
2
species present in the P2.5 glass.
Fig. 12. Schematic representation of the normal mode displacement assigned to the Q
2
species for the P2.5 model (PO
4
structural unit connected to 2 SiO
4
groups). Colour coding:
Si light blue, oxygen red, phosphorous yellow; frequencies expressed in cm
-1
.
The simulated IR spectra for the phosphate groups of the three phosphorous-containing
models have been then compared one to each other and to the phosphorous-free structure
P0, as displayed in Figure 13.
The first evident difference between phosphorous-free P0 and the other models is the
absence of bands in the spectral region at high frequencies (1200-1400 cm
-1
). As we have
discussed above, that is the typical region of the P=O stretching mode of phosphate groups.
This mode is shifted to lower frequencies and the band is broadened when passing from
P2.5 to P9.5. Another clear indication of the presence of phosphate groups is the band at
about 600-700 cm
-1
, which corresponds to the O-P-O bending region. The 1100-800 cm-
1
spectral range, on the contrary, is not easily assigned to phosphate groups inside the
bioglass since also Si-O stretching are located in that zone. However, the effect of increasing
the P
2
O
5
content inside the unit cell is reflected in a general broadening of the P-O stretching
and O-P-O bending modes.