Biomedical Engineering Reference
In-Depth Information
with the black spectrum, so that this methodology has been adopted to compute the spectra
for the larger structures with variable P content. In other words, the differences in peaks
between the red and the blue spectra of Figure 10 are due to the presence (blue line) or
absence (red line) of the extra SiO
4
group.
Fig. 10. Simulated IR spectra of the similar 45S5 Bioglass® model in the following sequence
from bottom to top: full frequency calculation (black line), full frequency calculation
including only PO
4
-involved modes (red line) and fragment calculation considering in the
fragment PO
4
and SiO
4
which is directly bonded to PO
4
. No IR intensities are reported and
the chosen band width is of 20 cm
-1
.
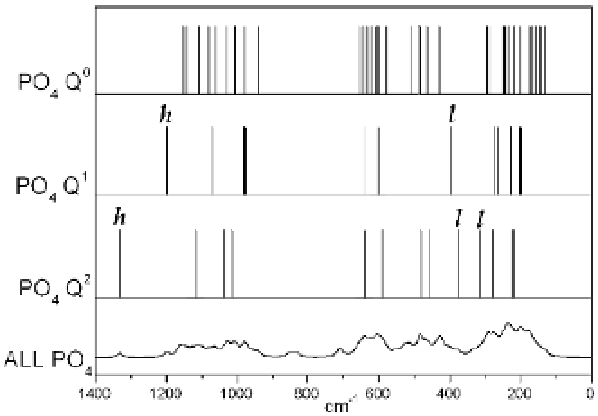
Fig. 11. IR peaks assignment for phosphate groups of the P2.5 model based on the different
Q
n
species. Label
h
and
l
refer to the peculiar bands at high and low frequencies,
respectively, that allow us to distinguish the Q
0
species from the Q
1
and Q
2
. In case of Q
2
, see
Fig. 12 for the schematic representation of the associated normal modes.