Biomedical Engineering Reference
In-Depth Information
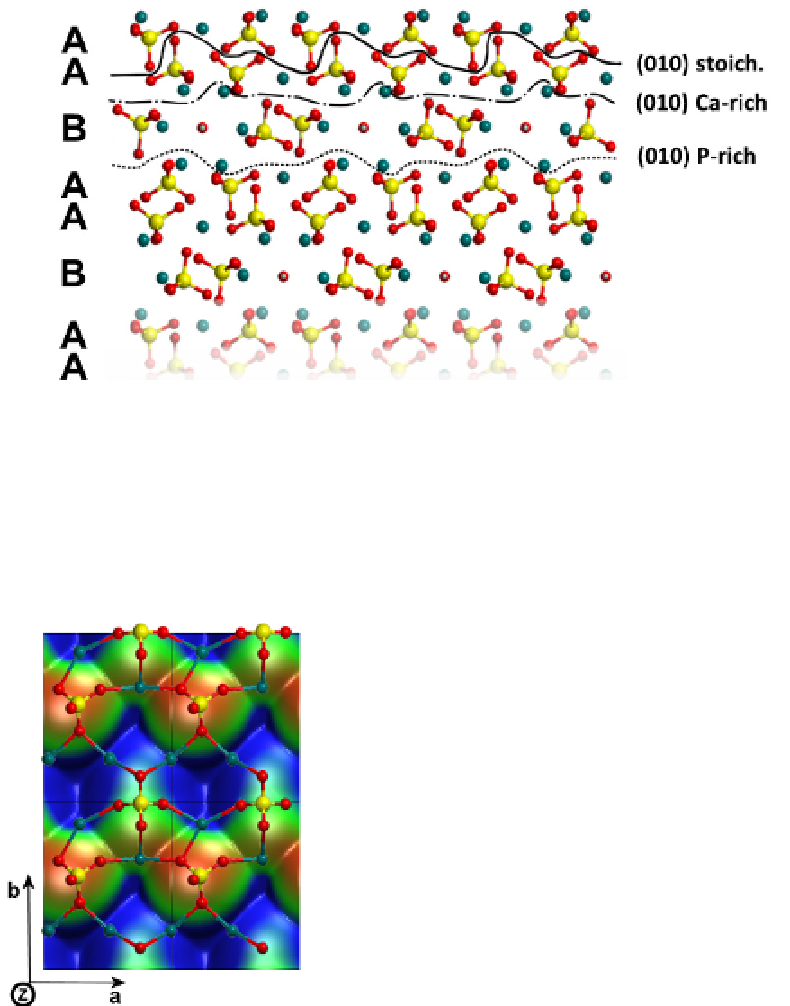
surface as its Ca/P ratio increases to 1.71. The last one is called
P-rich
(010) surface, with a
Ca/P ratio of 1.62.
Fig. 2. The three possible terminations along the [010] direction of HA. Colour coding:
calcium cyan, oxygen red, hydrogen grey and phosphorous yellow.
Clearly, due to the non-stoichiometric nature of these new surfaces, E
surf
cannot be defined
using the classical formula:
E
surf
= (E
slab
- n
·
E
bulk
)/(2
·
A)
(1)
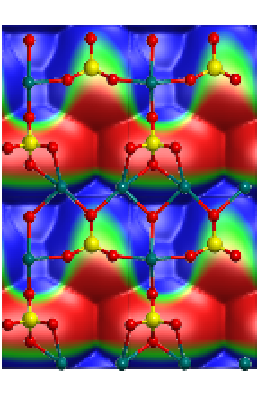
Fig. 3. Upper views of the three (010) surfaces: on the left side, the stoichiometric surface, in
the middle, the Ca-rich
surface and, on the right side, the P-rich surface. Each structure is
superimposed on an isodensity surface colorcoded with the electrostatic potential (blue is
most positive, red is most negative). The maps have been generated with the VMD program
(Humphrey, Dalke & Schulten, et al., 1996). Calcium represented in cyan, oxygen in red,
hydrogen in grey and phosphorous in yellow.