Biomedical Engineering Reference
In-Depth Information
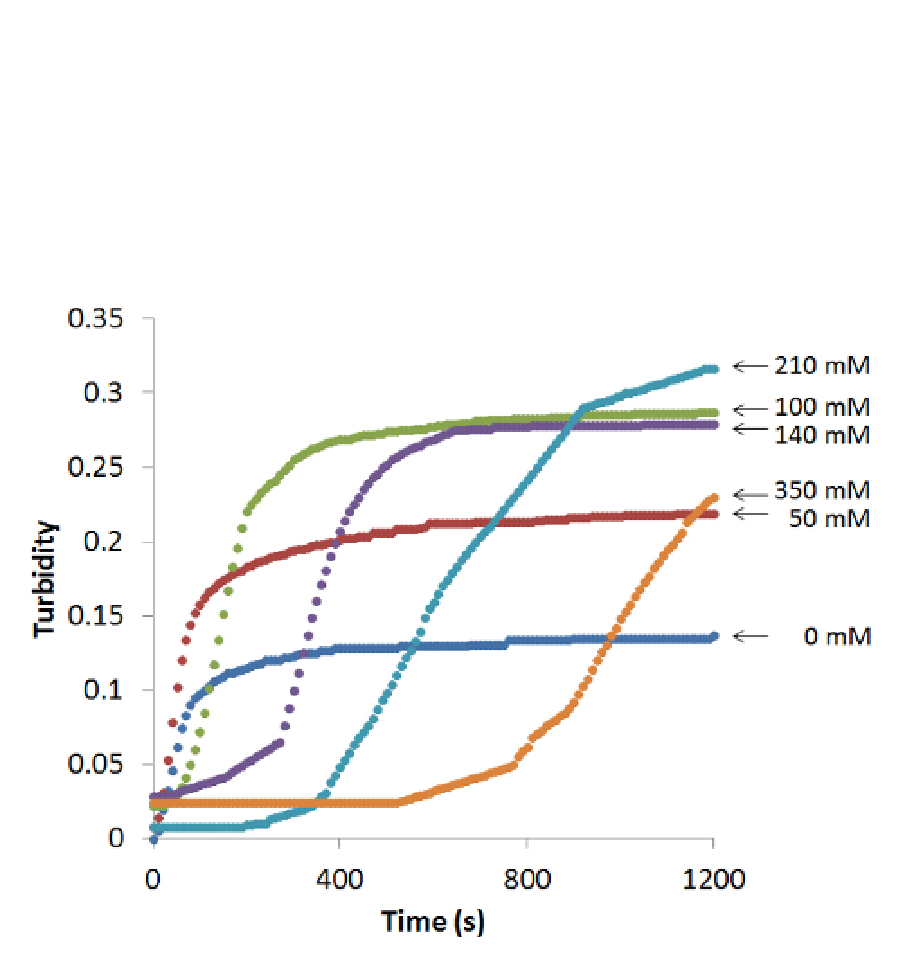
Fig. 2. Effect of NaCl concentration on fibril formation curve. The values in the graphs
indicate the final NaCl concentrations in the gels.