Biomedical Engineering Reference
In-Depth Information
surge of current with decreasing field since the model assumes that once the carriers have
tunneled into the insulator they are free to move within the material.
-3 0
-2 5
-3 1
-2 6
-3 2
-3 3
-2 7
-3 4
-2 8
-3 5
-3 6
-2 9
-3 7
-3 0
-3 8
0
1
2
3
4
10
3
E
-1
(V
-1
cm )
0.010
0.012
0.014
0.016
0.018
0.020
10
3
E
-1
(V
-1
cm )
(a)
(c )
-2 7
-2 2
-2 8
-2 4
-2 9
-2 6
-3 0
-2 8
-3 1
0.01
0.02
0.03
0.04
0
1
2
3
4
10
3
E
-1
(V
-1
cm )
10
3
E
-1
(V
-1
cm )
Pristine sam ple
A nnealed 320K
A nnealed 350K
A nnealed 400K
P ris tin e s a m p le
Annealed 320K
Annealed 350K
Annealed 400K
(d)
(b)
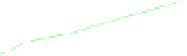
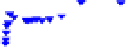
Fig. 6. Fowler-Nordheim curves: (a) Forward bias at low electric field (b) Reverse bias at low
electric field (c) forward bias at high electric field and (d) reverse bias at high electric field.
Fig. 7. shows curves of current density versus square root of electric (
ln J versus E
1/2
) in the
low field for forward bias regime. These curves neither support conduction mechanism by
Poole-Frenkel nor Schottky emissions which predict linear graphs of
ln J versus E
1/2
with
positive slopes. Fig.8 shows linear fittings of
ln J versus E
1/2
for forward and reverse bias at
high fields (10
4
-10
5
V/cm). The current levels in the reverse bias are higher than forward
bias. This behaviour may be interpreted either in terms of Poole-Frenkel effect which is due
to thermal excitation of trapped charges via field assisted lowering of trap depth or by
Schottky effect which is a field lowering of interfacial barrier at the blocking electrode
(Deshmukh et al. 2007). The expressions for these processes are given in Eq.(2) and (3)
respectively. Schottky coefficient ( β ) and Poole-Frenkel coefficient (
P
β ) are related as
shown in Eq. (4). Using the value of static dielectric permitivity (ε) of 3.0, (determined from
dielectric spectroscopy) theoretical values of β and
P
β obtained from Eq. (4) are 3.51×10
-
24
J V
1/2
m
1/2
and 7.01×10
-24
J V
1/2
m
1/2
respectively. Experimental values of β obtained from
the slopes of plots of
lnJ versus E
1/2
(Fig.8) at different temperatures are listed in Table 1. The
standard deviation and coefficient of linear correlation were obtained as 0.34 and 0.005