Agriculture Reference
In-Depth Information
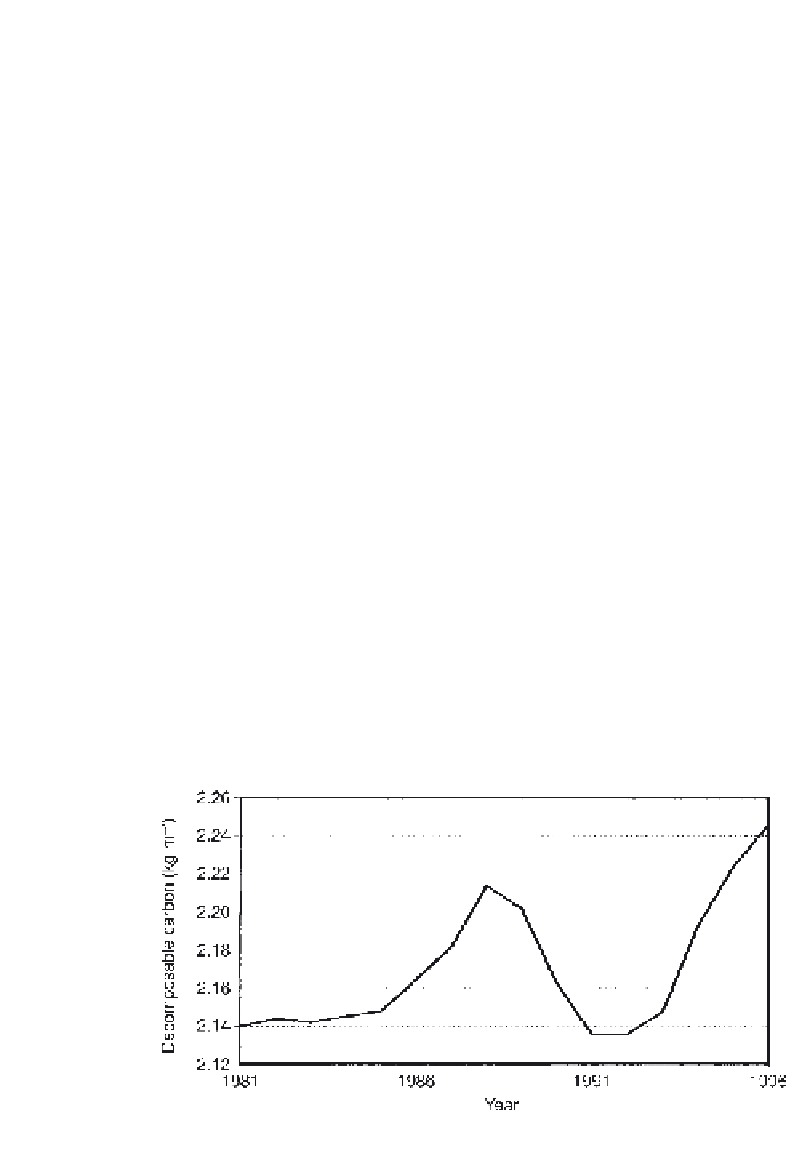
(Fig. 2.2.2). Using the amount of decomposable SOM as an indicator,
> 90% of the area is now at an optimal SOM level, and < 5% is classified as
'low' or 'high'. It is obvious that the system has not reached a steady
state. Despite some decreasing trends, most of the area shows a carbon
accumulation. Because of the very slow reaction time of SOM, it would be
more informative to evaluate the carbon input rates in order to predict the
future prospects. Taking the input rates of carbon reproducing SOM (C
rep
)
from 1993 to 1996 as an indicator, a large area has to be classified as 'very
high' in terms of supply of SOM (Fig. 2.2.3).
Despite the temporary very high contents of mineral nitrogen in the soil
(> 20 g m
−2
), the percolation water leaving the rooting zone meets the
quality conditions for drinking water. The total nitrogen export (leaching
plus gaseous losses) amounts to 4.4 g m
−2
year
−1
and is lower than the
nitrogen import from the air which is assumed to be ~6 g m
−2
year
−1
.
If the trend of carbon accumulation continues, a reduced nitrogen
efficiency is to be expected, with subsequent increasing export of nitrogen
Table 2.2.1.
Classification of the SOM content (SOM level) in terms of soil organic carbon (C
org
),
decomposable carbon (C
dec
) and soil organic carbon reproduction rates (C
rep
) relative to the
efficiency of the nitrogen input (N efficiency) for a Haplic Chernozem in central Germany.
SOM level
N efficiency
C
org
(%)
C
dec
(kg m
−
2
)
C
rep
(g m
−
2
year
−
1
)
Very low
< 1.50
< 1.80
< 1.45
< 60
Low
1.50-1.58
1.80-1.91
1.45-1.95
60-80
Normal
> 1.58
1.91-2.03
1.95-2.45
80-100
High
1.58-1.50
2.03-2.15
2.45-2.95
100-120
Very high
< 1.50
> 2.15
> 2.95
> 120
Fig. 2.2.2.
Regional average of decomposable carbon in soil.


Search WWH ::

Custom Search