Agriculture Reference
In-Depth Information
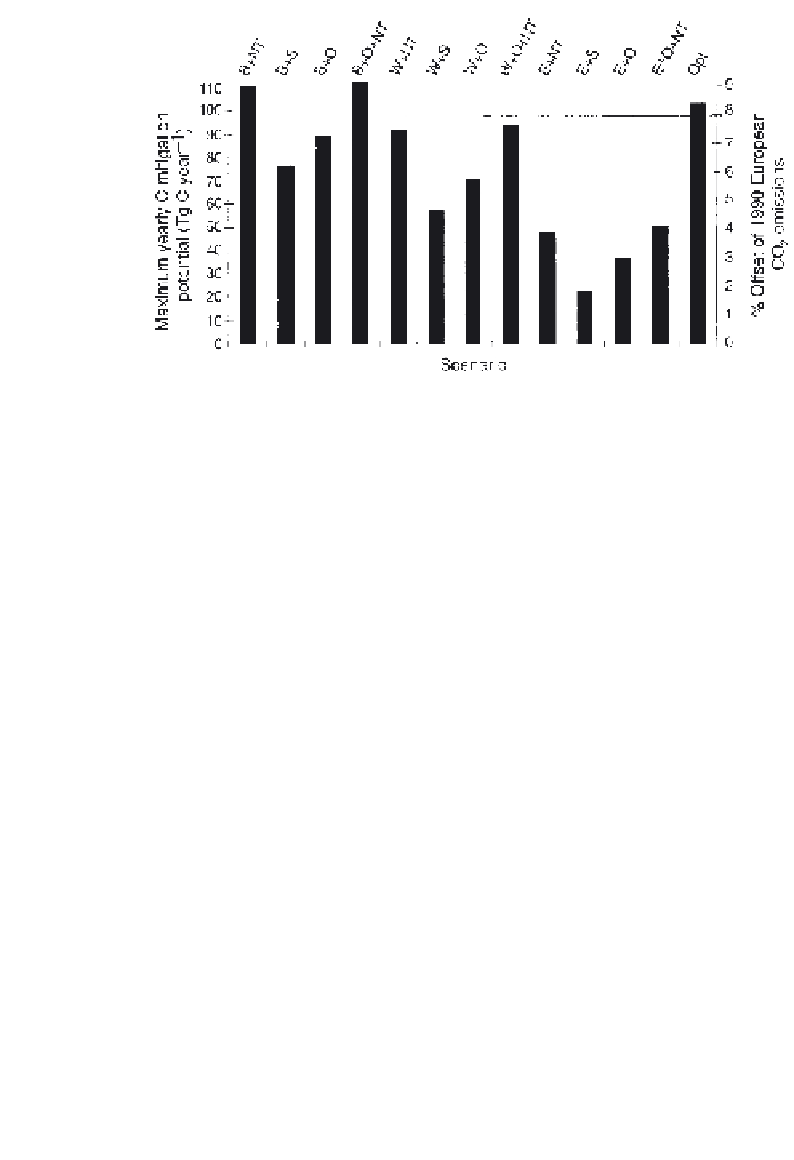
Fig. 4.13.3.
Carbon mitigation potential of combined changes in agricultural management
(Smith et al., 2000). The letter before the first '+' in each scenario indicates the land use employed
for 10% surplus arable land; B = bioenergy crops, W = woodland and E = extensification. The
letters after the first '+' in each scenario denote the management practice adopted on remaining
portions of arable land; NT = no-tillage, S = straw incorporation and O = addition of organic
amendments (animal manure and sewage sludge). See Smith et al. (2000) for further details.
2000). The greatest source of uncertainty, however, applies to all methods
of estimation; the uncertainty associated with establishing the baseline
(1990) conditions. Whether using simple statistical models, or simulation
models linked to spatial databases, parameters such as the amount of
manure available in Europe for agricultural use in 1990 have to be
estimated (in the absence of actual census data). Such estimates ultimately
are unverifiable and the best that can be done is to make sensible estimates
based upon known data, which in this example include head of cattle and
pigs in Europe, and equations to estimate the amount of manure produced
per head per year. The estimates form the inputs to the scenarios described
above or to the set up files of simulation models. Limitations in our ability
to reduce uncertainty associated with predictions of regional carbon
potential do not, therefore, lie in our technical capability, but in the lack of
data upon which we base our baseline estimates.
Acknowledgements
This work contributes to the following projects: Modelling SOM dynamics
using SOMNET (UK-BBSRC Grant: 206/A 06371), Modelling
Agroecosystems under Global Environmental Change (MAGEC - EU-
ENV4-CT97-0693),
EuroSOMNET
(EU-ENV4-CT97-0434)
and


Search WWH ::

Custom Search