Agriculture Reference
In-Depth Information
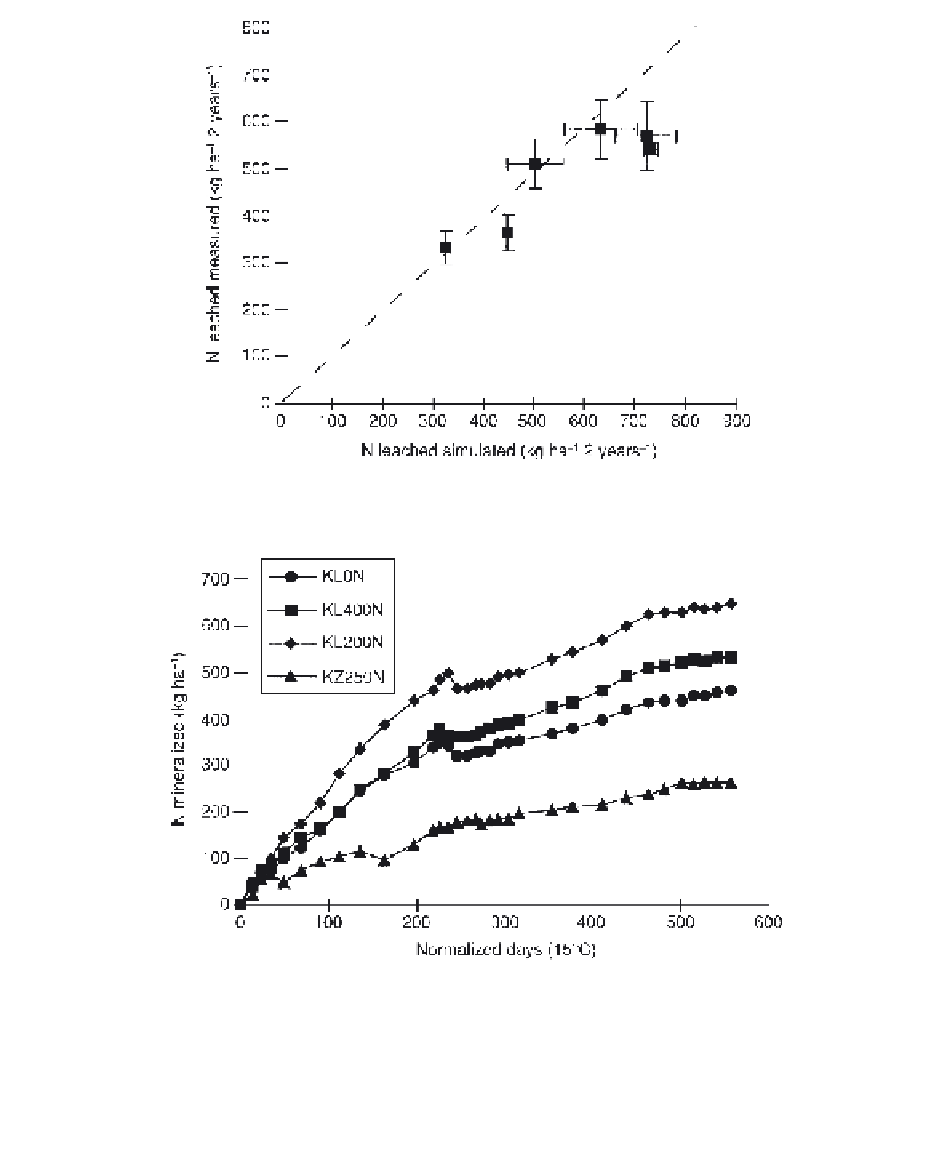
Fig. 4.2.3.
Comparison of measured and simulated leached N (total for 2 years after
destruction).
Fig. 4.2.4.
Mineralization kinetics simulated by LIXIM for KL treatments.
due to the low C : N ratio of the added residues. No significant differences
were observed between sites. After ~100 days of incubation, a second
phase occurred with lower mineralization rates of ~0.5 kg N ha
−1
day
−1
.
This lower mineralization rate is assumed to correspond to the 'basal'


Search WWH ::

Custom Search