Agriculture Reference
In-Depth Information
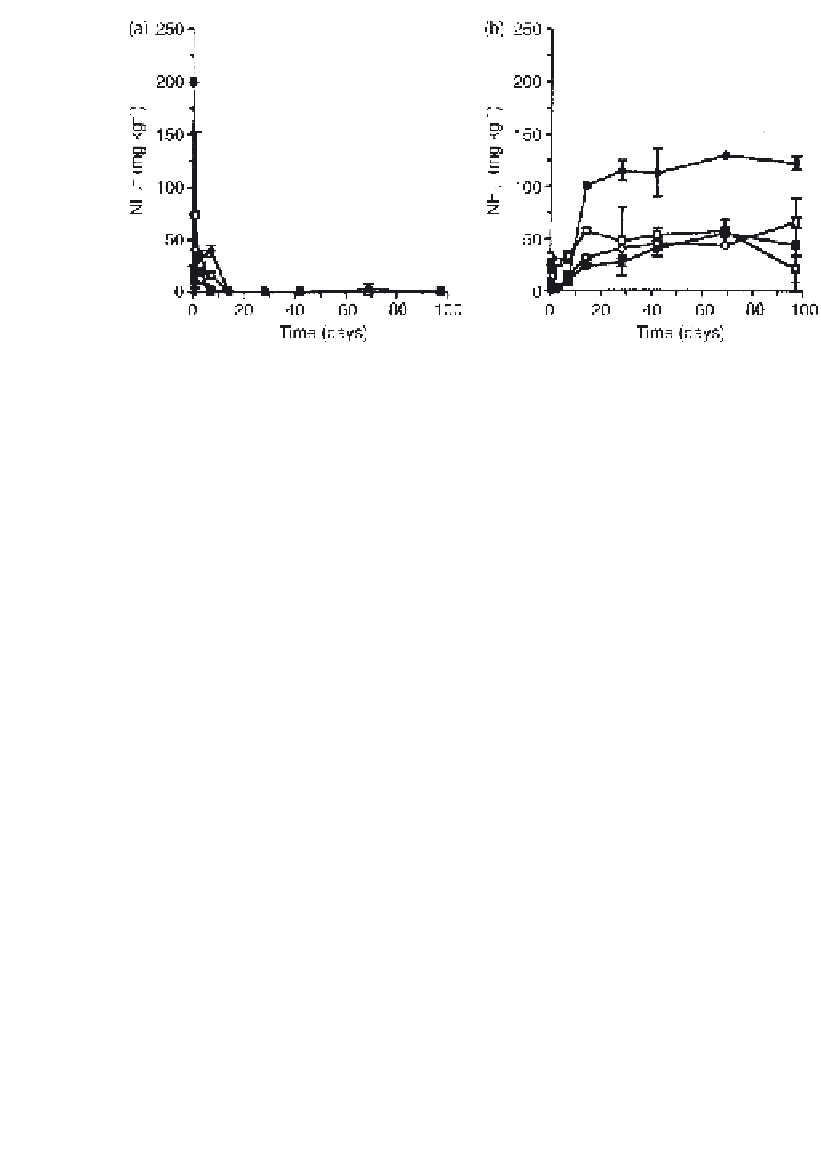
Fig. 3.12.2.
(a) NH
4
+
and (b) NO
3
−
concentrations (mg N kg
−
1
dry soil) in soil from an undrained
site (
) treated with 1000 mg of
14
C-labelled
glucose C kg
−
1
dry soil and 200 mg of NH
4
+
-N kg
−
1
dry soil incubated aerobically for 97 days at
22
) and sites drained for 1 (
), 5 (
) and 8 years (
w
v
q
r
C. Bars are
1
SD
.
°
±
sample remained < 50 mg NO
3
−
-N. The NO
3
−
concentrations in the glu-
cose-treated soil showed a decrease in the first 3 days, but increased there-
after in all soils; the largest increase was found in the soil drained for 8 years
(Fig. 3.12.2b).
Discussion
Production of CO
2
and
14
CO
2
The undrained soil and soil drained for 1 year, with an electrolytic conduc-
tivity of 40 and 80 dS m
−1
, respectively, showed the smallest percentage of
organic C mineralized, suggesting that the salts inhibited the microbial
activity. The decrease in CO
2
production from 2.1 to 0.89 g C kg
−1
after 90
days reported by Pathak and Rao (1998) with an increase in electrolytic
conductivity in the soils from 1 to 97 dS m
−1
, was much larger than we
found. However, they added salts to soil (NaCl and CaCl
2
) so the micro-
organisms may not have been adapted to osmostic and/or specific ion stress
and this might have inhibited their activity.
The percentage mineralized glucose C in the soil drained for 8 years
was similar to values reported by Bremer and Kuikman (1994), but it was
less in the other investigated soils. The differences in percentages of miner-
alized glucose C pointed to a possible effect of large salt concentrations on
metabolic processes, but possible effects of other soil characteristics, such
as pH, cannot be excluded.


Search WWH ::

Custom Search