Agriculture Reference
In-Depth Information
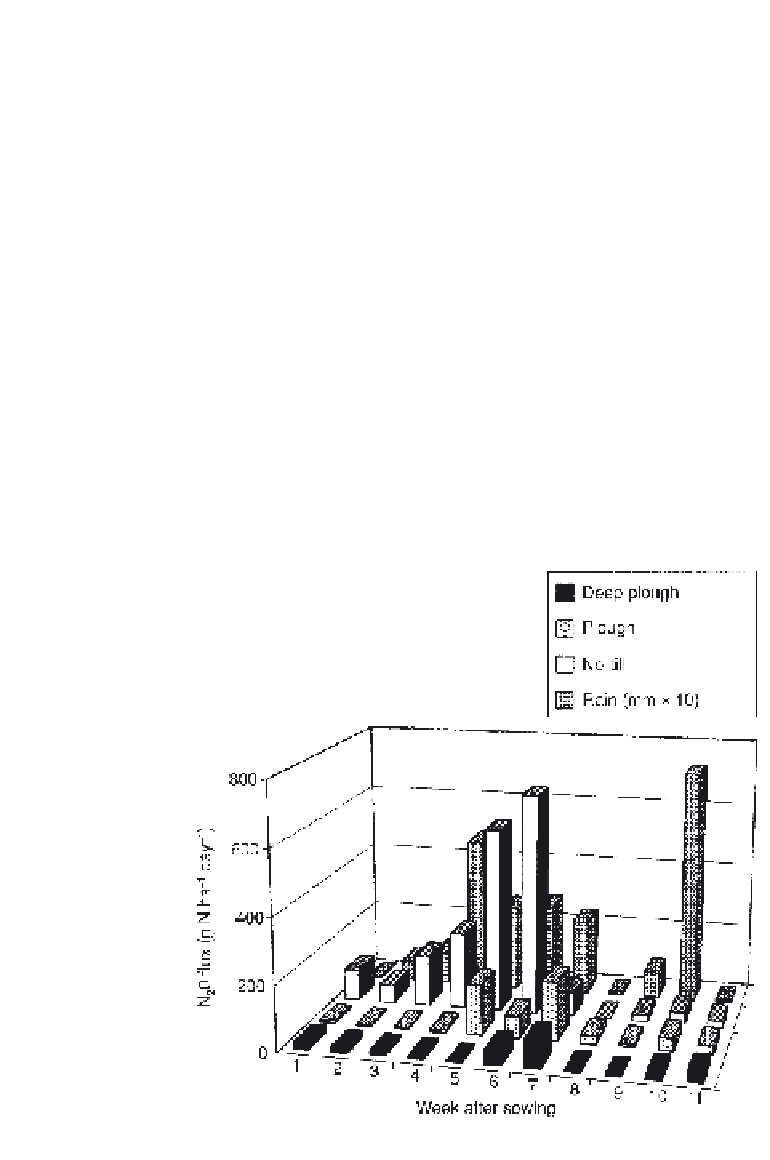
rainfall. These were particularly high from no-tillage under spring barley
in 1997 (Fig. 3.5.3). Existing models of soil nitrogen dynamics failed to
simulate these large, rapid responses, indicating that we need more
sophisticated models to enable us to predict the behaviour of such systems.
Effects of tillage on CO
2
emissions were less consistent than for N
2
O,
and average rates were generally < 20 kg C ha
−1
day
−1
. High fluxes (up to
130 kg C ha
−1
day
−1
) shortly after tillage were related to ploughing depth.
Emissions were low from no-tillage after heavy rain due to soil anaerobic
conditions in the soil.
In 1997, tillage differences in CO
2
emissions (Fig. 3.5.4) were small,
with typical emissions of between 5 and 25 kg C ha
−1
day
−1
. Emissions
reduced almost to zero under no-tillage after a period of particularly
heavy rainfall. These emissions related well to soil temperature at 200 mm
depth. Under winter barley, weekly estimates of nitrous oxide emission
were much lower and differed little between treatments, with typical
values of 50 g N ha
−1
day
−1
. In the autumn, there was a pulse emission of
75 kg CO
2
-C ha
−1
day
−1
which lasted only 2 h after ploughing and was
associated with soil disturbance releasing trapped CO
2
.
In 1998, we measured gas emissions intensively in the period
immediately after cultivation. CO
2
emissions showed a strong flush in the
Fig. 3.5.3.
N
2
O emissions from soil in the weeks after sowing spring barley in 1997.


Search WWH ::

Custom Search