Agriculture Reference
In-Depth Information
shown), as variability among replicates was large. However, it tended to be
lower in TB soils than burnt soils from 0-20 mm at Mackay and Tully
(mean 0.14
µ
gNg
−1
day
−1
in TB, and 0.32
µ
gNg
−1
day
−1
in burnt soils).
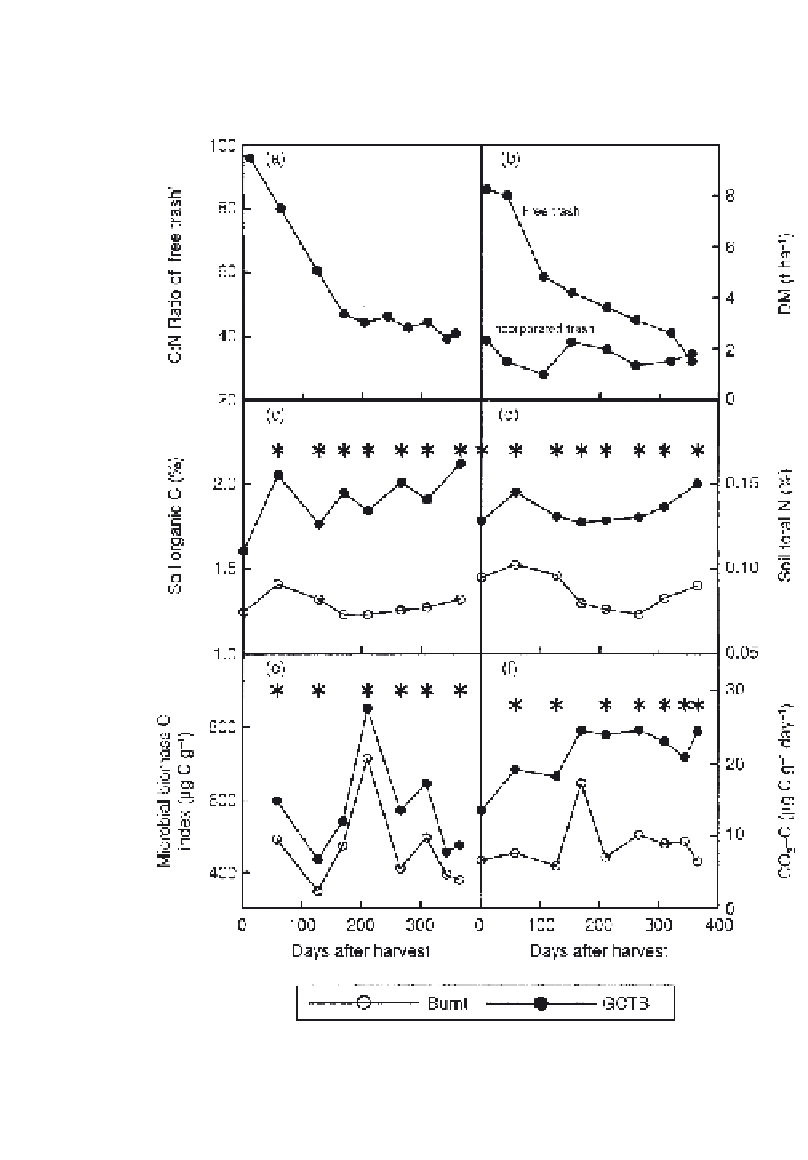
Fig. 3.1.1.
Representative data from the field experiments: (a) C : N ratio of free trash from
Harwood-Late; (b) dry matter of free and incorporated trash from Harwood-Early; (c) soil organic C
(0-50 mm) from Tully; (d) total soil N (0-50 mm) from Tully; (e) microbial biomass index (0-50 mm)
from Tully; and (f) C mineralization potential (0-50 mm) from Tully. Significant treatment
differences marked * (P< 0.05).


Search WWH ::

Custom Search