Agriculture Reference
In-Depth Information
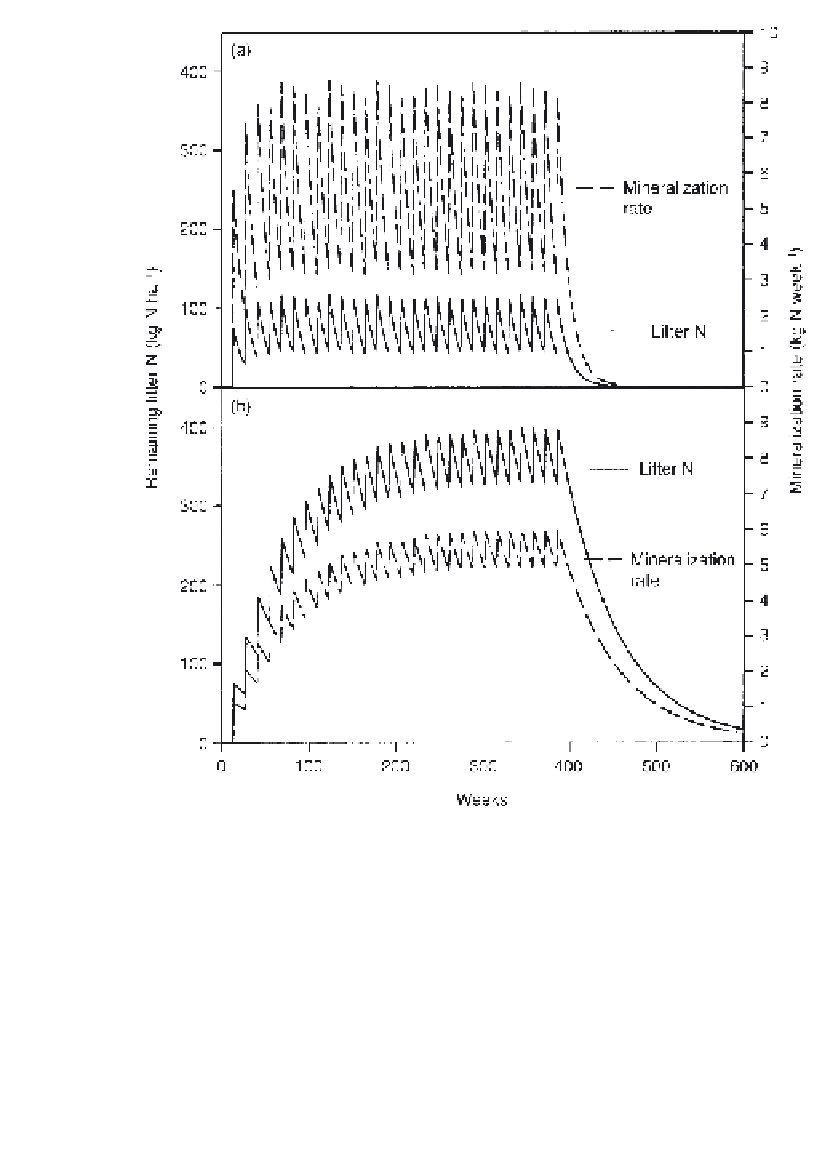
Fig. 3.4.
Modelled temporal variation derived from a single exponential decay model using
repeated applications of legume pruning at a rate of 75 kg N ha
−
1
3 months
−
1
. (a) Gliricidia sepium
with N mineralization rate constant k= 0.074 week
−
1
and (b) Calliandracalothyrsuswith N mineral-
ization rate constant k= 0.015 week
−
1
.
We recognize that this simplified model approach has limitations and
needs verification. However, it revealed potentially important long-term
implications of systems with different residue qualities in nutrient supply
patterns.


Search WWH ::

Custom Search