Biology Reference
In-Depth Information
(A)
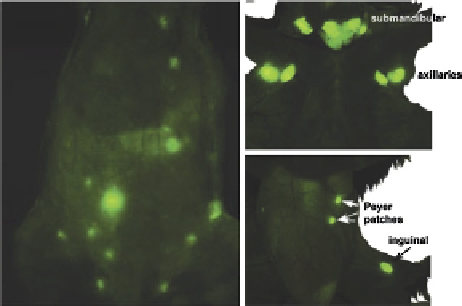
(B)
(C)
63
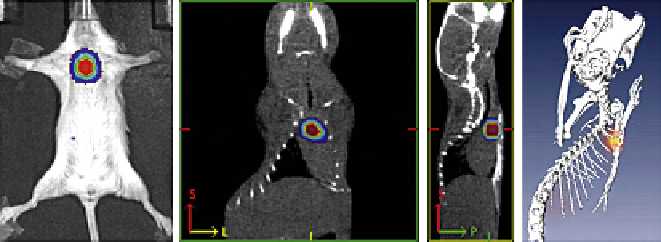
(D)
(E)
FIGURE 4.1
Visualization of GVHD and GVL. (A) Bioluminescence imaging of T-cell infiltration of lymphoid organs followed by migration to GVHD target tissues (adapted from Beilhack
et al.
[23]
). (B)
In vivo
fluorescence imaging of eGFP
+
allogeneic splenocytes in lymph nodes and Peyer's patches 7 days after infusion (adapted from Panoskaltsis-Mortari
et al.
[86]
). (C) PET imaging of FDG uptake in the colon during GVHD corresponds with tissue infiltration of eGFP
+
donor lymphocytes (adapted from Stelljes et al.
[102]
).
(D) Magnetic resonance imaging time course of CD8
+
T-cell homing to tumors. Top: axial slices through mouse thighs at (from left to right) 0 h, 12 h, 16 h and 36 h post
transfer. Bottom: three-dimensional color-scaled reconstructions of images above (adapted from Kircher et al.
[113]
). (E) Bioluminescence tomography superimposed on
computed tomography (CT) data clearly visualizes T-cell precursor infiltration of the thymus (adapted from Na et al.
[116]
)
.


Search WWH ::

Custom Search