Biology Reference
In-Depth Information
NRM rates of 71%, whereas patients who present with no or one risk factor
(standard risk) experience 1-year NRM rates of 30% (
p
< 0.0001)
[22]
.
Early identification of patients at high risk for steroid unresponsiveness may
permit alternative testing or additional therapies before the development
of refractory disease. Equally important is the identification of low-risk
patients who will respond well to treatment. These patients may tolerate a
more rapid tapering of steroid regimens to reduce long-term toxicity, infec-
tions, and a loss of the GVL effect. A schema of the scenario for treatment of
steroid-resistant GVHD using biomarkers is shown in
Figure 19.4
.
The ability to identify patients at high risk for GVHD early after their trans-
plantation and treatment course has important therapeutic consequences,
including more stringent monitoring and/or preemptive interventions. To
determine whether our validated biomarkers could predict GVHD before
the appearance of clinical symptoms, we evaluated the four most informa-
tive biomarkers (i.e., IL2R-α, TNFR1, elafin, and REG3α) in samples from
513 patients who had undergone unrelated HSCT and had not yet devel-
oped GVHD. Concentrations of each biomarker were assessed at days 7,
14, 21, and 28 post-HSCT
[90]
. The endpoint was the development of grade
II-IV aGVHD by day 56 post-HSCT. Day 56 was chosen by assuming that the
biomarkers at a given time point would not reliably predict the occurrence
472
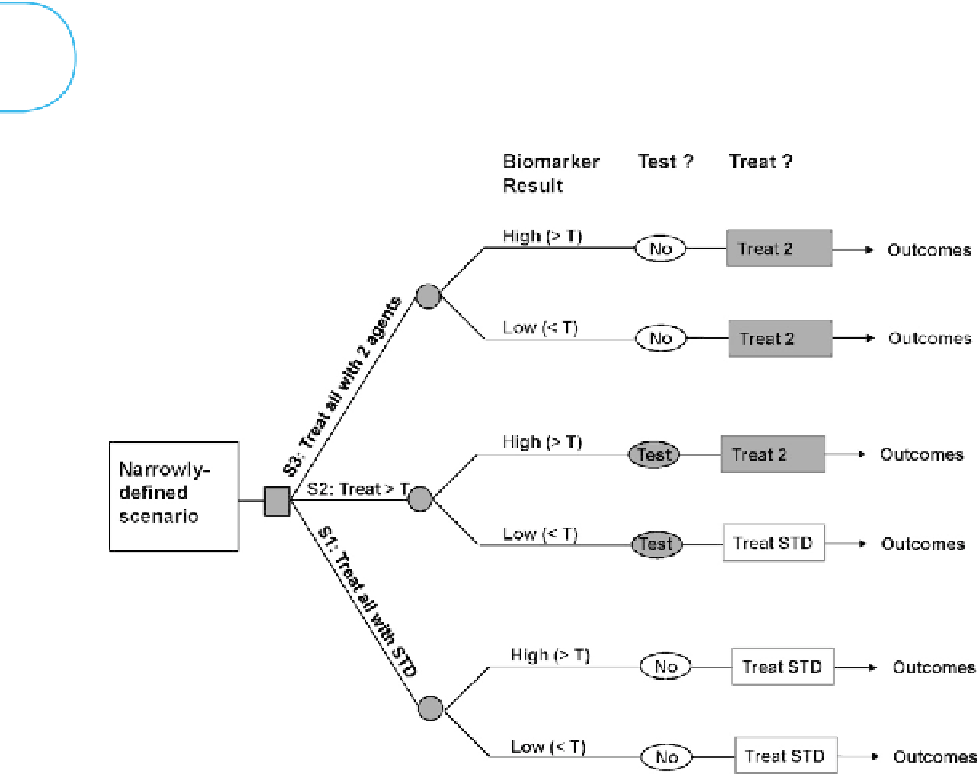
FIGURE 19.4
Decision tree for modeling clinical utility of a biomarker. Each scenario in a decision tree should be defined narrowly, in such a way that a single treatment strategy
would be clinically reasonable in the absence of the biomarker result. Making the scenario narrow allows the resulting estimate to represent a relatively homogeneous
effect that is easy to translate into practice. The square node represents the decision node; in this example, three different strategies are evaluated (S1-S3). Round nodes
are probability nodes. In this example, the round nodes indicate a split of patients into subgroups defined by the underlying distribution of the biomarker; probabilities of
having a high or low biomarker result (defined by the test threshold). STD, steroids.
Search WWH ::

Custom Search