Database Reference
In-Depth Information
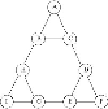
Figure 10.7
Betweenness scores for the graph of
Fig. 10.1
Clearly, edge (
B, D
) has the highest betweenness, so it is removed first. That leaves us
with exactly the communities we observed make the most sense, namely: {
A, B, C
} and
{
D, E, F, G
}. However, we can continue to remove edges. Next to leave are (
A, B
) and (
B,
C
) with a score of 5, followed by (
D, E
) and (
D, G
) with a score of 4.5. Then (
D, F
), whose
score is 4, would leave the graph. We see in
Fig. 10.8
the graph that remains.
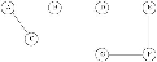
Figure 10.8
All the edges with betweenness 4 or more have been removed
The “communities” of
Fig. 10.8
look strange. One implication is that
A
and
C
are more
closely knit to each other than to
B
. That is, in some sense
B
is a “traitor” to the community
{
A, B, C
} because he has a friend
D
outside that community. Likewise,
D
can be seen as
connected.
□
10.2.6
Exercises for Section 10.2
EXERCISE
10.2.1
Figure 10.9
is an example of a social-network graph. Use the Gir-
van-Newman approach to find the number of shortest paths from each of the following
nodes that pass through each of the edges. (a)
A
(b)
B
.
Figure 10.9
Graph for exercises
EXERCISE
10.2.2 Using symmetry, the calculations of
Exercise 10.2.1
are all you need to
compute the betweenness of each edge. Do the calculation.