Java Reference
In-Depth Information
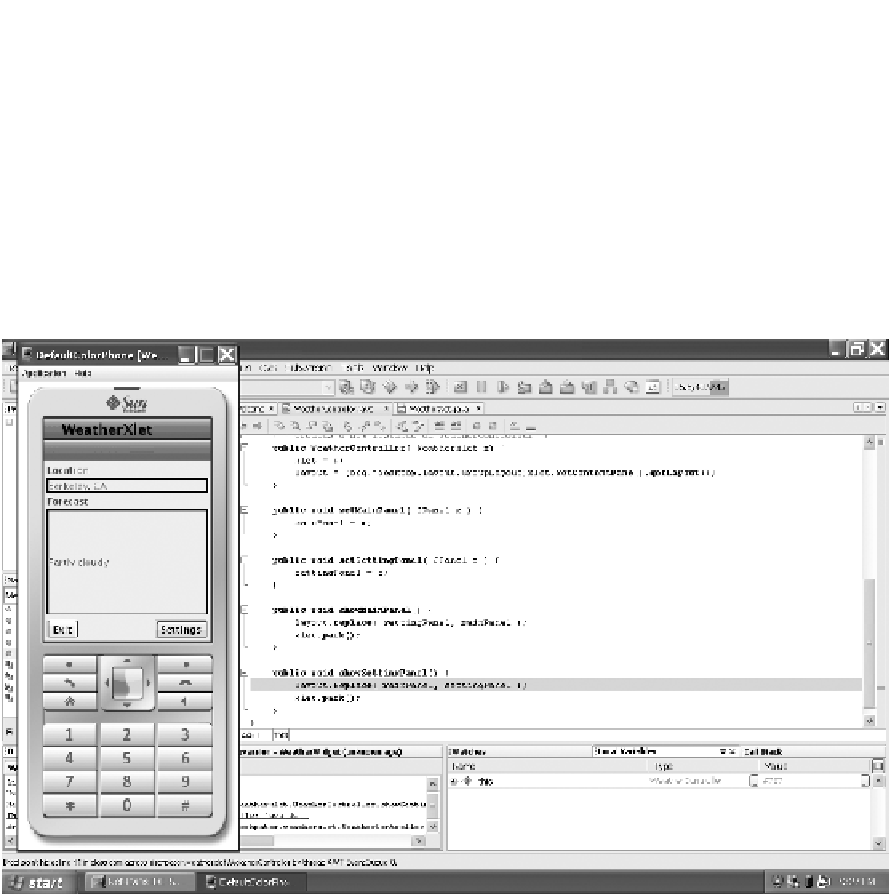
the menu bar (or press Ctrl+F8). The line of code with the breakpoint will be highlighted
in red, and a red square will appear in the window's left margin, indicating that execution
will pause at that line during debugging. You can begin execution by choosing Run
➤
Debug Main Project (or pressing F5, or clicking the second of the three arrows in the tool-
bar). When you do this, execution will begin normally, but when you click the Settings
button in the emulator, execution will stop at the breakpoint, letting you single-step
through the
showSettingPanel
, examine variables and the call stack using the inspector
windows in the lower right, and so forth (see Figure 3-17). I encourage you to experiment
with these options on your own.
Figure 3-17.
Execution paused at a breakpoint for debugging
Packaging and Executing CDC Applications
How you package and execute your Java ME applications on CDC-enabled devices will
vary from device to device, but Java Web Start and the Java Network Launching Protocol
( JNLP) let you work the same way you do with desktop applications. Like packaging for
the CLDC/MIDP, using one of these means for packaging your application involves creat-
ing both a JAR file for your application and an accompanying descriptor file, as well as an
additional policy file that indicates the permissions required by the application. Unlike