Biology Reference
In-Depth Information
trum at the emission maximum is
I
0
, initial fluorescence of
intact virus.
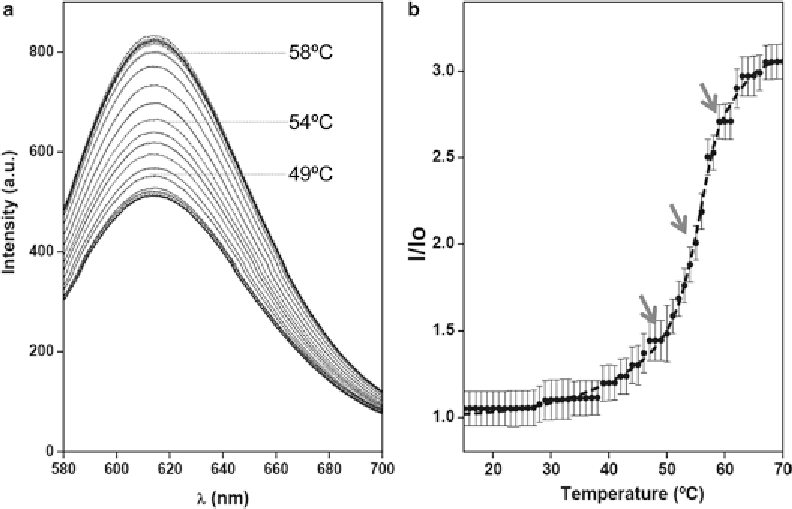
7. Take a new virus sample subject to a particular stress condition.
For example, to investigate thermostability, heat independent
samples at different temperatures for 15 min, add PI to the
concentration determined in
step 3
, equilibrate for 5 min at
the same temperature in the fluorimeter cell, and take their
emission spectra as described in
step 6
(
see
Fig.
1a
).
8. Correct each spectrum by subtraction of the correct blank
intensities for each condition.
9. Make the experiment in triplicate by recording three indepen-
dent spectra for each condition tested. Calculate the maximum
emission intensity +/− the standard errors for the three inde-
pendent spectra for each condition, after subtraction of the
corresponding blank spectrum.
10. Plot the ratio of PI fluorescence to the initial emission (
I
/
I
0
) at
the maximum position as a function of stress condition values
(
see
Fig.
1b
).
Fig. 1
Adenovirus thermal stability studied by PI fluorescence spectroscopy. (
a
) Series of raw emission spectra
taken at different temperatures. Some temperature values are indicated. (
b
) Extrinsic fluorescence curve
obtained after data processing and experiment replication (error bars for three independent measurements per
temperature).
Arrows
indicate the temperature points showed in (
a
). Data correspond to immature virions
produced by the Ad2
ts1
mutant [
2
]