Environmental Engineering Reference
In-Depth Information
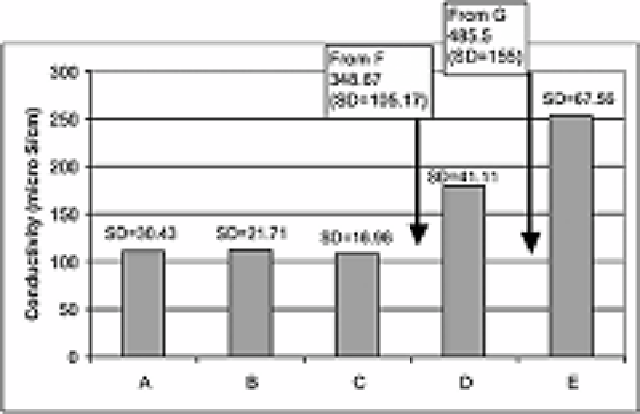
Figure 11.4. Spatial variation of EC
along the Lilongwe River.
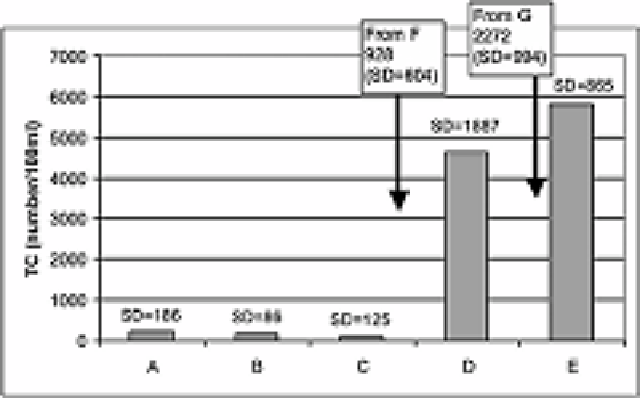
Figure 11.5. Spatial variation of TC
along the Lilongwe River.
The results with respect to COD and BOD are relatively low and do not support the
findings with respect to TC. COD values along the river vary within a range of 16-31
mg/l (variation of SD = 6-25 mg/l) and BOD values vary from 2 mg/l to 5 mg/l. No
significant spatial variation was found among the different sampling locations.