Environmental Engineering Reference
In-Depth Information
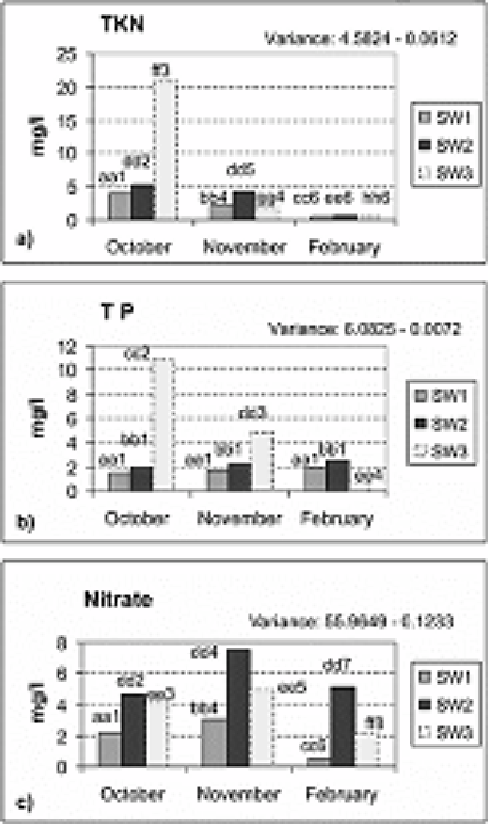
The seasonal variation of TP (Fig.8.7b) shows a significant difference only at SW3,
with maximum concentrations during October, which decrease with the start of the rains.
In February, the TP concentrations at SW
3
have been reduced up to ten times, compared
to the ones in October. The spatial variation indicates to an impact from the farm area at
SW
3
only. A sharp increase in the TP concentrations at SW3 was found during the dry
and the beginning of the wet season, while during the wet season, they are lower than the
control point.
Figure 8.7. Spatial and seasonal
variations of TP, TKN and Nitrate.