Environmental Engineering Reference
In-Depth Information
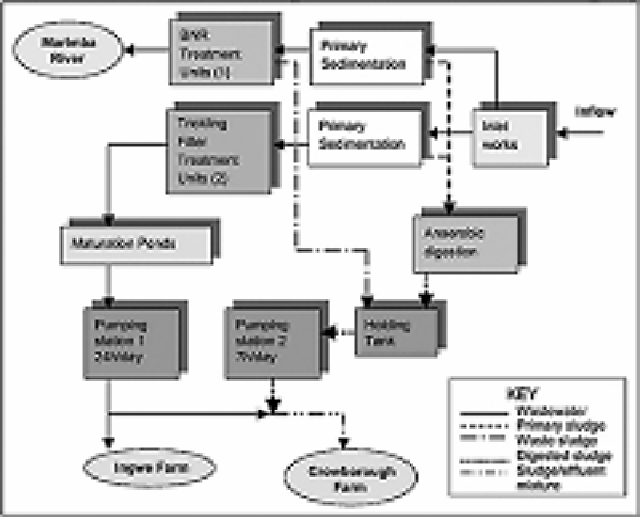
Figure 8.5. Scheme of the CWTW
flow chart.
(Chapters 3 & 4), as well as the runoff from medium density areas upstream this
discharge point. In addition, it collects the BNR effluent from CWTW. The design
capacity of this treatment unit is 18 000 m
3
/d (Hranova 2002), which constitutes between
60-80% of the base flow during the dry season.
The surface runoff and the seepage from the study area are drained into the Marimba
River and into Little Marimba River. The farm area, which drains into the Marimba
River, is protected by a dike (Fig. 8.3) and is also provided by an under-drain system for
the collection of the excess seepage. The portion of the farm area, draining into the Little
Marimba River, is not protected by a dike, but is provided with an under-drain system
too. During the study, it was not possible to obtain data regarding the operational
condition of the under-drain system. It might be blocked at some locations due to the long
period of operation. All this makes it difficult to accurately evaluate the expected surface
runoff and seepage contributed from the farm to the River.
Considering the different ways of pollution transport from the farm area into the
natural streams, we could differentiate four possibilities:
• Farmland seepage discharged by the underground drainage system;
• Direct runoff;
• Polluted groundwater discharge to the river;
• Direct leak from the wet areas.