Environmental Engineering Reference
In-Depth Information
C
19.1
0.191
13.52
F
13.6
0.136
20.17
During the period of study, a few odd showers had occurred at the end of October, but the
temperature and evapotranspiration rates were high enough during the day resulting in
virtually no effective rainfall. In general, relatively low rainfall events occurred, which
represents a low rainfall wet season. For this reason, the “dry-five day antecedent
rainfall” soil moisture condition was adopted.
Usually the Median Method and Joint Association Curve Numbers are used to adjust
the initial curve numbers regarding the soil moisture conditions into climatic zones
according to the Koppen climatic classification criteria (Shulze et. al. 1993). But in this
case the study area was too small and was not possible to adopt this method. Instead, the
curve numbers (CN) were determined by equations 5.2 and 5.3.
(5.2)
(5.3)
Where d= dry; a = average; and w = wet.
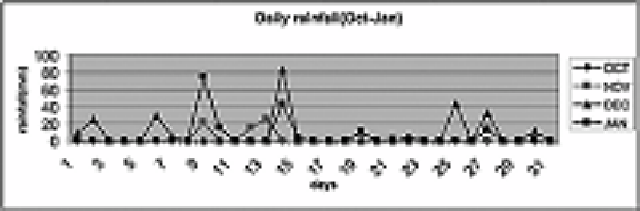
From Figure 5.6 it can be seen that there was little or no rainfall in most of the five
days prior to the sampling events. This has been due to an acute dry spell that has
occurred in almost all parts of the country. In this case the “dry” antecedent soil moisture
condition had been prevailing. The “dry” antecedent moisture conditions are considered
when the rainfall during such five days period is less than 35 mm.
After the initial curve numbers have been adjusted, the potential maximum soil water
retention (S) was determined. It is related to the hydrological soil properties, land cover
and land management conditions, and the soil moisture status of the catchment prior to
the rainfall event. This potential is related to the dimensionless response index termed
“the catchment curve number” (CN). It is the final curve number, adjusted for antecedent
moisture conditions. The relation between CN and S is shown in equation (5.4).
(5.4)
Figure 5.6. Daily rainfall patterns
during the period of study.