Biology Reference
In-Depth Information
advances and improvements in current 2-DE protocols, an adequate
and correct experimental design and statistical analysis of the data
tend to be ignored or not properly documented in current litera-
ture. The design of an experiment and its practical carryover are
important for increased robustness, but how the data are analyzed
is paramount for maximizing the information obtained [
3
]. Most
of the software packages for image analysis or LC-MS processing
embed some statistical tools and they can be considered adequate
for most of the researchers' purposes. These packages, however,
have several limitations, namely: (1) they do not rationalize
decisions when there are gel or chromatographic imperfections;
(2) spots/peaks are missing or mismatched, or other artifacts are
present, and (3) software-induced variation is not considered most
of the times [
3
,
4
].
Traditionally, quantitative proteomics data are assessed by uni-
variate statistics, such as ANOVA. Nevertheless, they are negatively
affected by the raw structure of the data, they cannot detect trends
or groups, and the possibilities or false positives increase. On
the other hand, multivariate analyses, such as PCA, ICA, or PLS,
are described to be more effective describing trends and reducing
the complexity of the data, since they are less affected by the struc-
ture of the data [
5
]. The combination of both univariate and
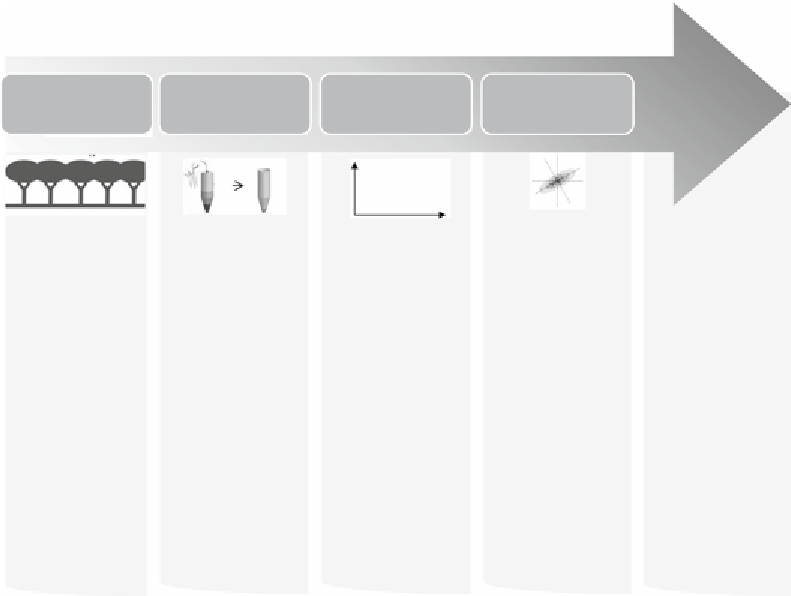
Experimental
design
Do
experiments
Data pre-
processing
Biological
interpretation
Data analysis
1.
Define differential
proteins by
parametric or non
parametric tests
2.
Explore the data
by PCA. If some
groups can be
distinguished look
forthe most
correlated proteins
3.
If PCA fails, use
ICA
4.
Use PLS-DA to
define those
variables with the
higercovarianceto
thetreatments
5.
Plot the data in a
heatmapto see
protein clusters and
its relation to the
different treatments
1.
Use differential
spots
2.
If be multivariate
analysis can
distinguishbetween
treatments, use the
most correlated
proteins to each
component(PCA,
ICA, PLSDA) to infer
whichbiological
processesare
condensedbehind
each component
3.
The visualization
of the data in
heatmaps, which
also show protein
clusters are also
variable for
interpretation.
1.
Sample quickly
and in the same
conditions for each
treatment
2.
Work clean and
in controlled
conditions
3.
If the samples
cannot be analyzed
at the same time,
batches should
contain
representativesof
alltreatments
4.
Experiments, if
possible, should be
conducted by the
same groupof
people
1.
Performimage
analysis/peak
quantitation. Always
supervise the
resultsmanually
2.
Impute missing
values
3.
Normalizedata
4.
Look for outliers
(PCA,%CV):
4.1.
Re-analyze
outliersamples
4.2
Check outlier
variables, remove
and impute them
4.3.
If the sample
cannot be fixed
repeat the
experimentfor the
“extrange” samples
5.
Tr ansformdata
1.
Define the
treatments
and the adequate
controls
2.
Define the
number of biological
replicates
3.
Randomize
plants and
treatmentsin the
greenhouse/growth
chamber
Fig. 1
Model workflow for a complete statistical analysis of proteomic datasets