Biology Reference
In-Depth Information
mixotrophic growth
photoautotrophic growth
1
0.5
0
-0.5
-1
0.5
4
3
0
2
1
-0.5
0
-1
-1
-2
PC 2 [5%]
PC 1 [89%]
-3
-1.5
-4
b
MAPA
4
mixotrophic growth
photoautotrophic growth
2
0
-2
-4
-6
2
10
0
5
-2
0
-4
-5
PC 2 [4%]
-6
PC 1 [71%]
-10
c
MAPA + MASS WESTERN
mixotrophic growth
photoautotrophic
1.5
1
0.5
0
-0.5
-1
-1.5
-2
2
4
1
2
0
0
-1
-2
-2
-4
PC 2 [12%]
PC 1 [78%]
-3
-6
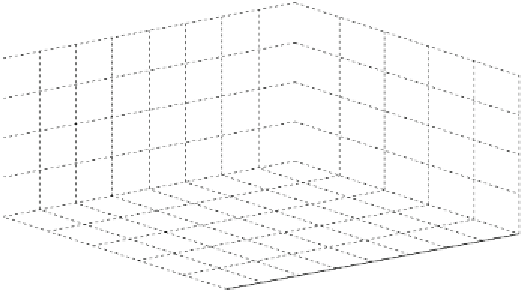
Fig.
2
(
a
) COVAIN-based principal components analysis (PCA) and sample pattern recognition for a MAPA protein
data matrix of two growth conditions of
Chlamydomonas reinhardtii
—mixotrophic and photoautotrophic [
16
].
Visible is the clear separation of the two growth types. The separation in the principal component analysis
is due to the differences in tryptic peptide
m
/
z
-ratio abundances. (
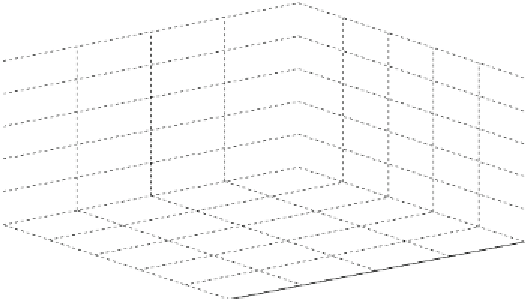
b
) COVAIN-based principal components