Biology Reference
In-Depth Information
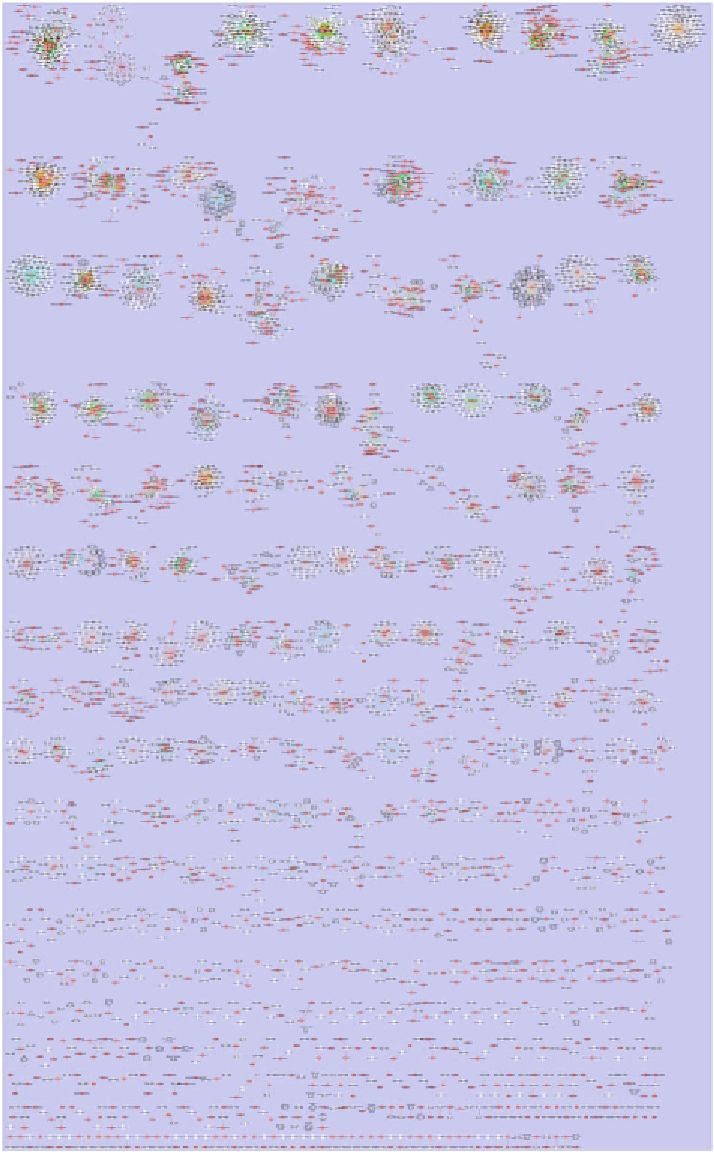
Fig. 2
Cytoscape view of the identifi ed proteins in Musa. Nodes that represent a protein are visualized in
white
,
peptides in
red
. Interactions with a ladder score between 0 and 50 are visualized in
red
, a score between 50
and 60 between in
orange
and >60 in
green
(color fi gure online)