Biology Reference
In-Depth Information
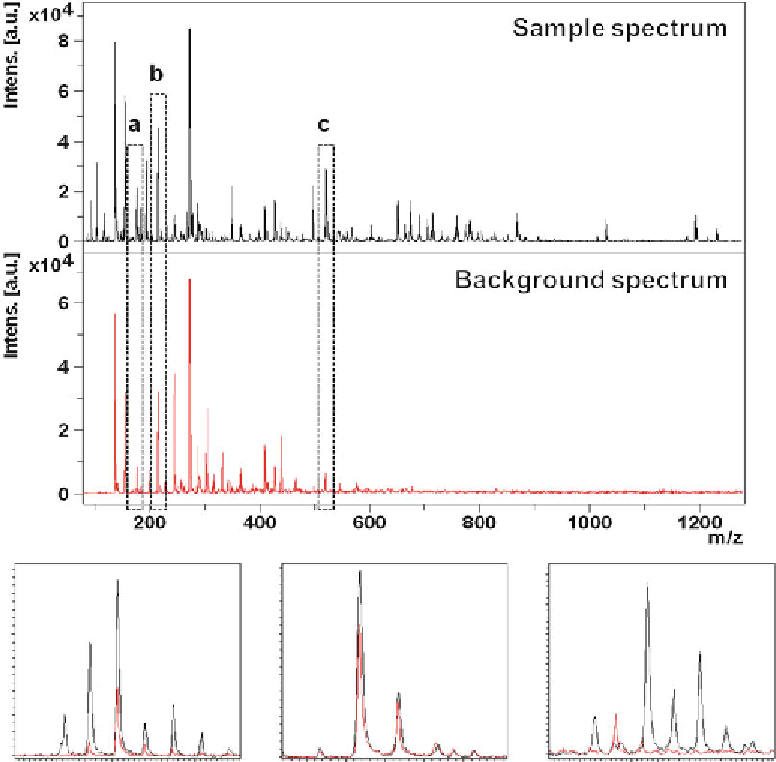
region for background acquisition is located next to the tissue
section and randomly measured along with the sample. After
the MSI run sum spectra of both regions are compared with
each other. Signals that totally overlay with matrix background
are excluded from further analysis as it is not possible to distin-
guish if signals are just matrix derived or if other compounds
sharing the same molecular mass are additionally present.
Furthermore, isolation of such an
m/z
value for MS/MS mea-
surements carried out directly from the tissue section is not
possible without getting matrix fragmentation pattern.
Figure
3
shows a mass spectrum from a barley seed methanol
x10
4
x10
4
x10
4
a
b
3.0
c
4
2.0
2.5
1.5
3
2.0
1.5
1.0
2
1.0
0.5
1
0.5
0.0
0.0
0
174
175
176
177
178
179
180
181
m/z
214
215
216
217
218
517
518
519
520
521
522
523
524
525
m/z
m/z
Fig. 3
Sample spectrum of a barley methanol extract (
black
) compared with DHB derived background signals
(
red
). Measurements were carried out in positive ionization mode using a MALDI TOF/TOF instrumentation (Bruker
Daltonics, Bremen, Germany). The lower spectra show overlays in the designated
m/z
regions (color fi gure online)