Image Processing Reference
In-Depth Information
Table 12.1 Social network service weights per scenario
Scenario 1
Scenario 2
Scenario 3
Scenario 4
Scenario 5
Chat
0.3
0.2
0.3
0.2
0.1
Talk
0.3
0.3
0.2
0.2
0.1
Video conf.
0.4
0.5
0.5
0.6
0.8
Number of Interacons with User 1
900
800
700
600
500
400
300
200
100
0
User
2
3
4
5
6
7
8
9
10
VideoConf
0
30
100
0
100
150
0
400
600
Talk
100
120
80
200
200
200
200
200
100
Chat
200
150
120
300
200
150
700
300
200
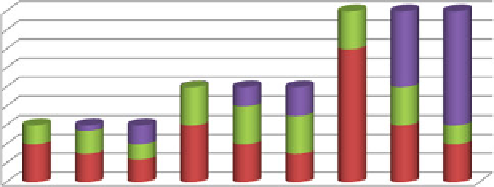
Fig. 12.3 Number of Interactions between User 1 and Users 2-10
Interacon probability of User 1
0,6
0,5
0,4
Scenario 1
Scenario 2
Scenario 3
Scenario 4
Scenario 5
0,3
0,2
0,1
0
1
2
3
4
5
6
7
8
9
10
User
Fig. 12.4 Interaction probability of User 1
In Fig.
12.3
, we summarize some indicative interactions between User 1 and
Users 2-10. We have selected the values in order to reflect different communication
volumes and different media types.
In Fig.
12.4
, we show the interaction probability of User 1 with Users 2-10
calculated using the Eq. (
12.1
). It can be seen that user 10, who has the largest
number of video conference events with user 1, has also the highest probability to
interact.
In Fig.
12.5
, we show the location connectivity behaviour of Users 1-10. We
assume that there are 4 locations/nodes that each user could be connected at and we