Image Processing Reference
In-Depth Information
10.3.5.2 Classification of Observers
When considering the influence from relative disparity and velocity, people may
have different sensitivity on them. Thus, it may be interesting to classify them into
different groups and analyze the different influences of relative disparity and
velocity on different observers.
The relative disparity and the planar velocity are two factors that may induce
visual discomfort in our study. Thus, the analysis which factor is dominant in
determining the visual discomfort is conducted on each observer. There are two
hypotheses in this analysis:
• Hypothesis 1: the relative disparity is predominant;
• Hypothesis 2: the velocity is predominant.
The methods to measure which factor is more predominant are based on the
p
1
and
p
2 values, where:
•
p
1: the proportion of each observer voting for the stimulus whose relative
disparity is larger;
•
p
2: the proportion of voting for the stimulus whose velocity is faster than the
other one.
s opinion on these two hypotheses can be reflected by (
p
1,
p
2)
which can be expressed by a point in a two-dimensional space. According to these
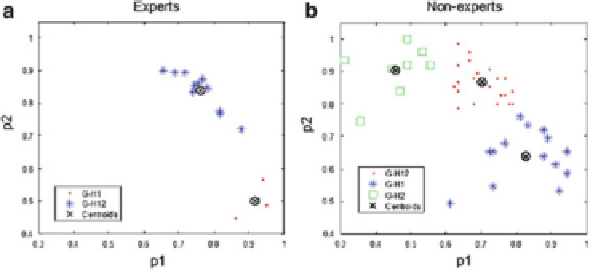
points, the observers can be classified as different groups. In our study, the K-means
clustering method was used. For better illustration, we define the term G-H1 (Group
of Hypothesis 1) to represent the observer group who voted more according to
Hypothesis 1, which means relative disparity is predominant in determining visual
discomfort. A similar definition is used for G-H2. G-H12 is for the group who are
equally sensitive to relative disparity and velocity, like the global subjective results.
The clustering results are shown in Fig.
10.11
. The BT scores for all stimulus
generated by each observer cluster are shown in Fig.
10.12
.
Each observer
'
Fig. 10.11 The clustering results for experts and non-experts observers.
x
-Axis represents the
agreement on “relative disparity is the predominant factor” and
y
-axis represents the agreement on
“velocity is the predominant factor”