Image Processing Reference
In-Depth Information
All the factors shown in Table
10.4
are statistical significant factors with p-value
of the student
0.05. The coefficient in the table is the coefficient of the
corresponding factor in the linear model. The model analysis shows the linear
model for each motion type. The
R
2
, RMSE, the
F
-statistic, and its
p
-value are
provided as the evaluation results of this model.
D
represents visual discomfort
score. It is shown that for the planar motion stimuli, the relative disparity, planar
motion velocity, and their interaction term are important factors for visual discom-
fort. For the static stimuli, the relative disparity offset in this study shows its
predominant effect. For the in-depth motion stimuli, the disparity amplitude is
not a main factor. However, the interaction term of the disparity amplitude and
the velocity, and the combination of the three factors (velocity, disparity amplitude,
relative disparity offset) play an important role in determining visual discomfort.
According to the regression analysis results, an objective model for comparing
visual discomfort of still stereoscopic images, planar motion stimuli, and in-depth
motion stimuli is developed. All disparity and velocity values are measured in
visual angular degree. Here we rewrite it as:
s
t
-test
<
'
8
<
:
2
:
53
r
o
þ
0
:
54
static
D
¼
1
:
45
r
o
þ
0
:
18
v
p
0
:
04
r
o
v
p
1
:
11
planar
ð
10
:
3
Þ
0
:
31
r
o
þ
1
:
23
v
d
þ
ð
0
:
45
0
:
21
r
o
Þ
d
a
v
d
þ
2
:
51
indepth
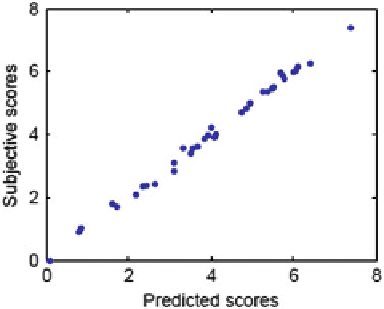
The scatter plot of the objective and subjective results is shown in Fig.
10.9
. The
Pearson Linear Correlation Coefficient (PLCC), Spearman
s Rank Correlation
Coefficient (ROCC), and Root Mean Square Error (RMSE) are used to evaluate
the correlation between the objective scores and the subjective results, and they are
0.9976, 0.9967, and 0.1198, respectively.
As this model is based on the paired comparison results, the
D
can be used to
compare the degree of visual discomfort between the stimuli. The difference can be
interpreted as the probability that one condition is preferred to another.
'
Fig. 10.9 The scatter plot
of the predicted scores and
the BT scores