Image Processing Reference
In-Depth Information
a
c
1
1
0.98
0.96
0.95
0.94
0.92
0.9
0.9
0.85
0.88
0.86
0.84
E-SSIM colour vs. SSIM colour
Approximation for the colour image
E-SSIM depth vs. SSIM depth
Approximation for the depth map
ESSIM_colour vs. SSIM_colour
Approximation for the colour image
ESSIM_depth vs. SSIM_depth
Approximation for the depth map
0.8
0.82
0.75
0.82
0.84
0.86
0.88
0.9
0.92
0.94
0.96
0.98
1
0.75
0.8
0.85
0.9
0.95
1
Full-Reference SSIM method
Full-Reference SSIM method
b
d
1
1
0.95
0.95
0.9
0.9
0.85
0.8
0.85
0.75
ESSIM_colour vs. SSIM_colour
Approximation for the colour image
ESSIM_depth vs. SSIM_depth
Approximation for the depth map
ESSIM_colour vs. SSIM_colour
Approximation for the colour image
ESSIM_depth vs. SSIM_depth
Approximation for the depth map
0.8
0.7
0.65
0.7
0.75
0.8
0.85
0.9
0.95
1
0.75
0.8
0.85
0.9
0.95
1
Full-Reference SSIM method
Full-Reference SSIM method
e
1
0.95
0.9
0.85
0.8
E-SSIM colour vs. SSIM colour
0.75
Approximation for the colour image
E-SSIM depth vs. SSIM depth
Approximation for the depth map
0.7
0.65
0.7
0.75
0.8
0.85
0.9
0.95
1
Full-Reference SSIM method
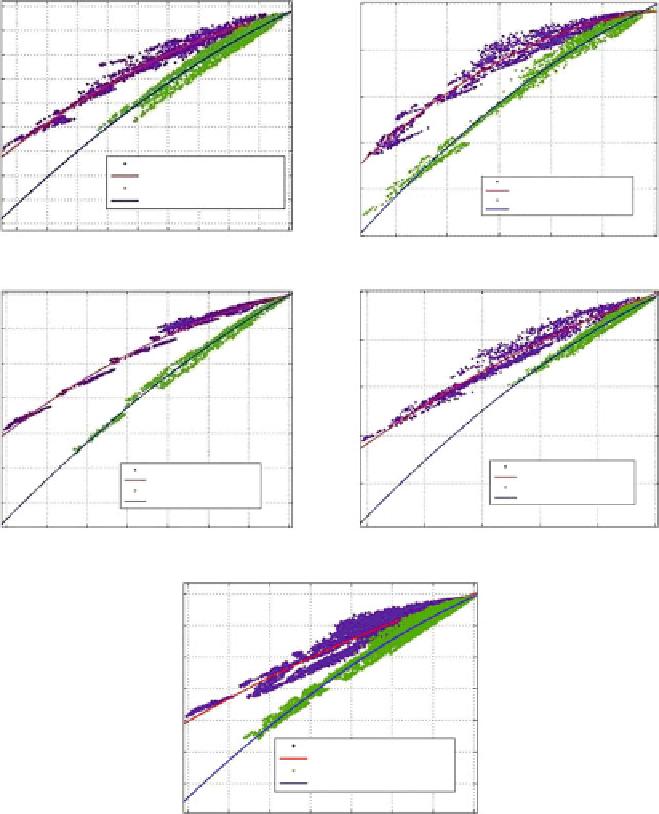
Fig. 9.6 Scatter plots of the proposed
Near NR
method versus
FR
method at different compres-
sion levels and PLR/(
E
S
/
N
0
)(a)
ballet
sequence, (b)
interview
sequence, (c)
orbi
sequence, (d)
breakdance
sequence, and (e) all the sequences in general
2
SSIM
D
p
1
E-SSIM
D
ð
Þ
þ
p
2
E-SSIM
D
ð
Þ þ
p
3
ð
9
:
15
Þ
where
p
1
,
p
2
,
and p
3
are constants and they have different values based on (
9.14
)
and (
9.15
).
Figure
9.6e
shows the scatter plot for the measured image quality (i.e., quality of
both color image and depth map) using the
FR
and the proposed
Near NR
methods