Image Processing Reference
In-Depth Information
After downscaling, the quantized saliency map S
q
is obtained as follows:
S
q
¼
b
S
1
=
3
, where S represents the down-scaled (non-quantized) saliency map.
The non-quantized saliency maps are gray level images coded with 255 levels.
Hence, the maximum Qp offset value is
c
255
1
=
3
6.
In Fig.
6.15
, two examples of Qp offsets images obtained from the dense
saliency map are showed. For the two sequences “Musicians” and “Actors,” the
effect of the post-processing is noticeable. The salient regions cover more pixels
than in the saliency map due to the merging effect and the transitions between
regions are more progressive.
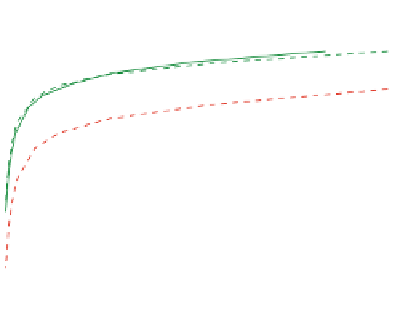
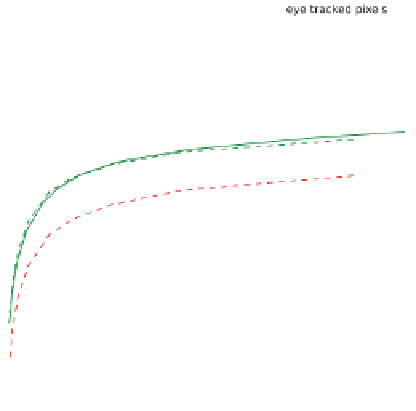
The rate-distortion curves obtained with the two sequences after H.264 encoding
are provided in Fig.
6.16
. In this figure, we can see the interest of the approach,
especially when the bit rate increases. For instance, for the “Actor” sequence at a
quality level of 42 dB, the encoding with VAM allows saving more than 40% of the
b
c
¼
Fig. 6.16 Video coding
performances with the TIS
approach (
Top
: “Musicians”
sequence,
Bottom
: “Actors”
sequence)