Image Processing Reference
In-Depth Information
Fig. 6.3 The IS method [
19
],
above
, vs. the Proposed (TIS) [
29
] method,
below
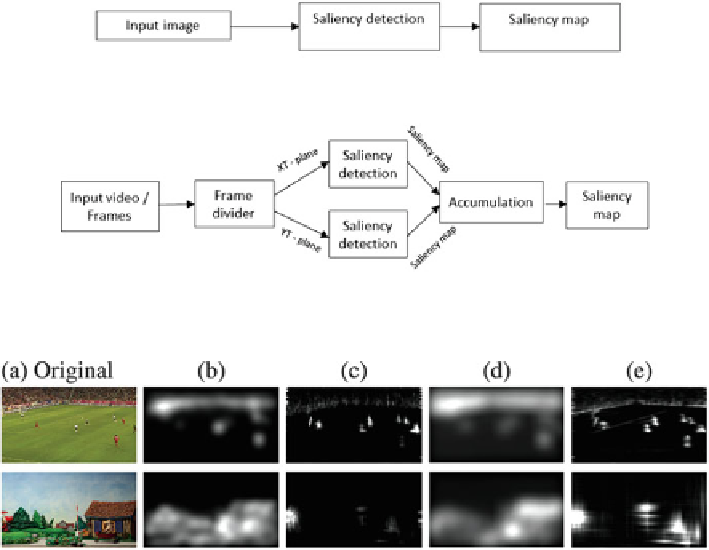
Fig. 6.4 Visual comparison of state-of-the-art approaches (b [
20
], c [
11
], d [
19
]) with the
proposed TIS approach [
29
], (e). In comparison the proposed method detects and highlights
more salient regions.
Note: The Foot-ball sequence is copyrighted by the EBU whereas the second
sequence “Sandmannchen” is copyrighted by mdr, NDR and rbb, scopas medien AG, 2011
S
alMap
ð
t
Þ
¼
hMapXY
ð
t
Þþ
vMapXY
ð
t
Þ
ð
6
:
5
Þ
MapXT and MapYT represent horizontal and vertical maps, SalMap is the final
saliency map, I
XT
and I
YT
are the slices of the images in horizontal and vertical
axes. “sign (DCT(I))” is the IS method [
19
] applied on the image.
Conclusion and Results After TIS is applied on a video sequence, it is
observed that maps for few frames in the beginning as well as in the end are quite
noisy. This is due to splitting of the video information into XT and YT planes.
Artifacts occur at the XT and YT planes edge when the IS method is applied on
it. Therefore when the map is converted back to XY plane those artifacts end up in
the first and last few frames. Noisy maps can be discarded by splitting the video into
sequences of, e.g., 50 frames each overlapping each other.
Furthermore, the proposed approach delivers important contextual information,
therefore can also be seen as an automatic activity detector for motions of different
objects. Comparison of a saliency map obtained from the proposed TIS approach
(e) with the results of saliency maps obtained from other state-of-the-art approaches
is shown in Fig.
6.4
.