Database Reference
In-Depth Information
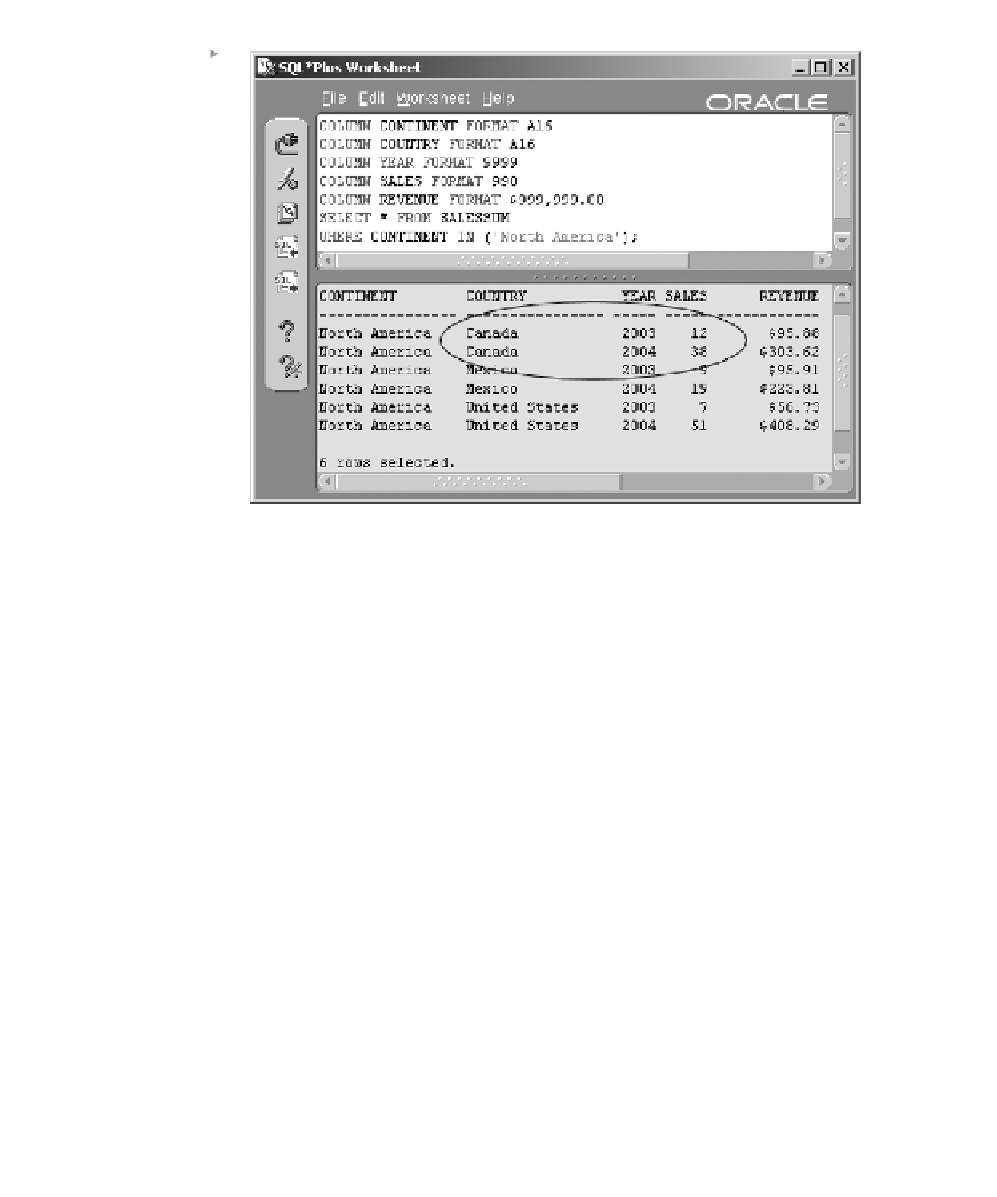
Figure 11.21
Some Summarized
Data.
2003) / 2004) + 1) * 2004. Thus the numbers for Canada plugged into the
equation would be (((38 - 12) / 38) + 1)38 = 1.68 + 38 = 64 (an increase in
sales quantities of about 168%).
SELECT COUNTRY, YEAR, Q FROM SALESSUM S
WHERE CONTINENT IN ('North America')
SPREADSHEET
PARTITION BY (COUNTRY)
DIMENSION BY (YEAR)
MEASURES (S.SALES Q)
RULES(Q[2005]=(((Q[2004]-Q[2003])/Q[2004])+1)*Q[2004])
ORDER BY COUNTRY, YEAR;
Thus in Figure 11.21, we have rows for 2003 and 2004, Canada shows
sales quantities of 12 for 2003 and 38 for 2004. Therefore, the projected
sales quantity for Canada for 2005 is 64 items, as already described.
Let's look at a slightly more detailed example. The following query ana-
lyzes both quarterly sales and quarterly revenues, selecting two continents
and partitioning by both continent and country. A partial result is shown in
Figure 11.23. Continents are sorted in descending order to show the break
between North America and Europe.