Agriculture Reference
In-Depth Information
high variability showed by different species in different environments, all our litters showed
comparable values.
Climatic or microclimatic differences among the experimental sites did not justified the
decomposition patterns of the eight studied litter species. Therefore a combination of climatic
influence and chemical composition effects was suggested.
90
P.laricio
Q.ilex BSS
M.communis
C.incanus
Q.ilex VES
Q.ilex CV
A.alba
F.sylvatica
p.pinea Ves
P.angustifolia
80
70
60
50
40
30
20
10
0
0
100
200
300
400
500
600
700
800
900
Decomposition time (days)
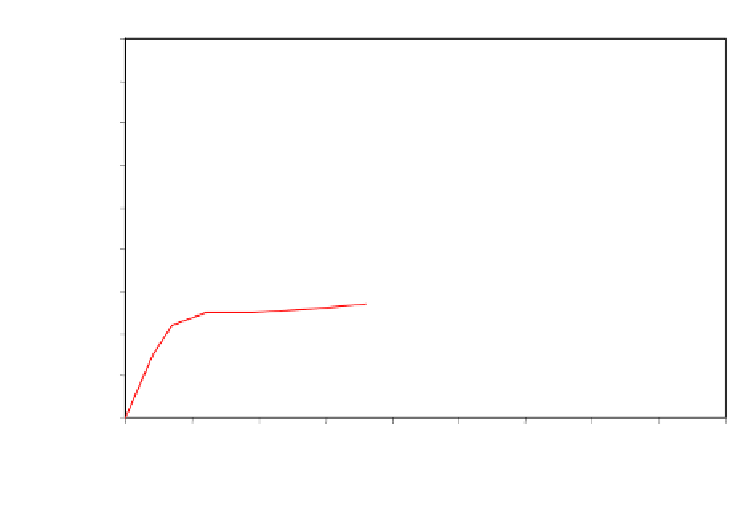
Figure 2. Accumulated mass loss versus decomposition time of
Myrtus communis
,
Cistus incanus
,
Phillyrea angustifolia
,
Quercus ilex
,
Fagus sylvatica
,
Abies alba
,
Pinus laricio
and
Pinus pinea
leaf
litters in their native sites in South Italy. Standard deviation was around 10%. Data from Fioretto et al.,
2000; Papa, 2000; Virzo De Santo et al., 1985, 1993; Fioretto et al. 1998; De Marco et al., 2004.
Table 2. Decay constants of the eight studied litters during the first year of
decomposition (K
1
) and during the remaining period concerning the second year and
the beginning of the third one (K
2
). The decay constants were calculated by the formula
X/X
0
= e
-kt
(X=mass remaining at time t, X
0
=initial mass) (Olson, 1963)
K
1
y
-1
K
2
y
-1
Myrtus communis
0.58 0.71
Cistus incanus
0.34 0.40
Phillyrea angustifolia
0.31* ----
Quercus ilex
0.29 0.14
Fagus sylvatica
0.43 0.16
Abies alba
0.40 0.10
Pinus laricio
0.17 0.13
Pinus pinea
0.29 0.10
* 1.58 by considering only the first 100 days of decomposition, when the mass losses were clearly
evident.