Biology Reference
In-Depth Information
a
b
Day 1
Day 2
Day 3
BL
f:
30Hz
p:
10ms
1min
c
10
5
0
-20 0
40
80
120 160 200
240
280
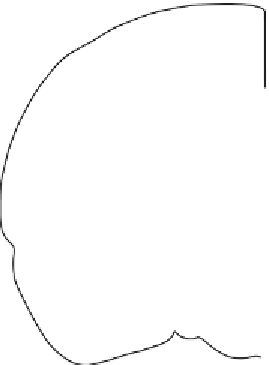
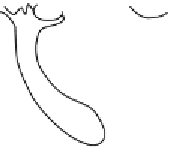
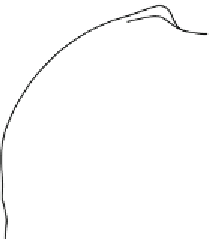
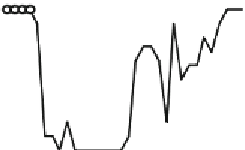
Fig 2
Scheme and experimental results of an in vivo optogenetic experiment. (
a
) Coronal view of the brain
showing placement of the cannulae through which the optical fi ber is protruding 1-2 mm to the central lateral
amygdala for direct illumination of fi bers. (
b
) Experimental protocol for fear conditioning—a rat is exposed to
2 days of conditioning, followed by 1 day of test. (
c
) Example trace of the decreasing fear response of a rat
upon
blue light
exposure (
blue line
). Note that the freezing response progressively comes back to normal val-
ues after the offset of
blue light
cut in order to protrude 1-2 mm beyond the lower end of the
cannula, allowing light stimulation directly above the region
of interest with a ~10 mW intensity. To this purpose, fi bers
need to be stripped over the shortest length possible with a
fi ber-stripping tool (ThorLabs, cat. no. T12S25) as described
in the protocols detailed in [
66
]. Afterwards, cut the fi ber at
the required length with a sharp razor blade.
Since light diffusion in the brain is very weak and most of the
power will be lost beyond more half a millimeter, a crucial step of
in vivo optogenetical experiments is the right targeting of intrace-
rebral cannulae. It is strongly recommended to perform prelimi-
nary implantations and verify the placement of the cannulae in
order to become suffi ciently familiar with correctly targeting the
region of interest.
2.4.2 Implantation
of Cannulae
General Considerations
1. Deeply anesthetize the animal, preferably with isofl urane (5 %
induction, 2 % maintenance—precise values depend on the
animal's weight and its fat proportion).
2. Shave the head and place the anesthetized animal in a stereo-
taxic frame.
Step by Step


Search WWH ::

Custom Search