Biology Reference
In-Depth Information
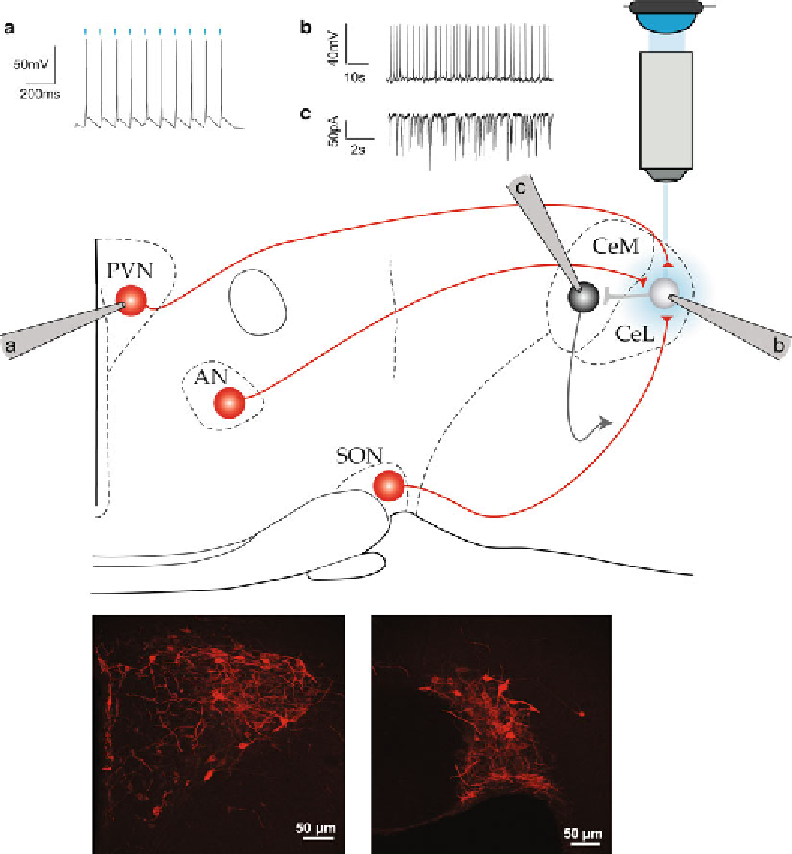
Fig. 1
Scheme of an experimental in vitro setup for optogenetic manipulation.
(a)
Whole-cell current-clamp
recording of a PVN neuron expressing the ChR2 virus (in
red
). Infected cells are illustrated in the
bottom pic-
tures
of PVN (
left
) and SON (
middle
). Each
blue light
pulse (10 ms) induces an action potential, demonstrating
suffi cient ChR2 expression in this neuron.
(b, c)
Cell-attached
(b)
and whole-cell voltage clamp
(c)
of neurons
in the central amygdala after
blue light
stimulation and evoked secretion of oxytocin. The
blue light
emitted by
a LED is focused on the region of interest through the objective of the microscope used to visualize the cells.
Spread of light is represented by the
blue circle
on the scheme.
PVN
paraventricular nucleus,
SON
supraoptic
nucleus,
AN
accessory nuclei,
CeL
, central lateral amygdala,
CeM
central medial amygdala
Four weeks after the virus injection, animals can be used for patch
clamp recordings and stimulation with blue light. Since these animals
are nearly 2 months older than the usual 2-3-week-old animals that
are typically used for patch clamp recordings, visualization of neu-
rons with DIC becomes more diffi cult. This is caused by the increase
2.3.3 Slice Preparation
General Considerations
Search WWH ::

Custom Search