Information Technology Reference
In-Depth Information
As can be seen in Table 2, the SS algorithm obtains the highest test error rate. In
this test, this method is deterministic, always obtaining the same solution, as demon-
strated by a standard deviation of zero for the classification error rate. The HS algo-
rithm outperformed the RS process, even with only 100 iterations of the algorithm,
both in terms of validation error rate and test error rate.
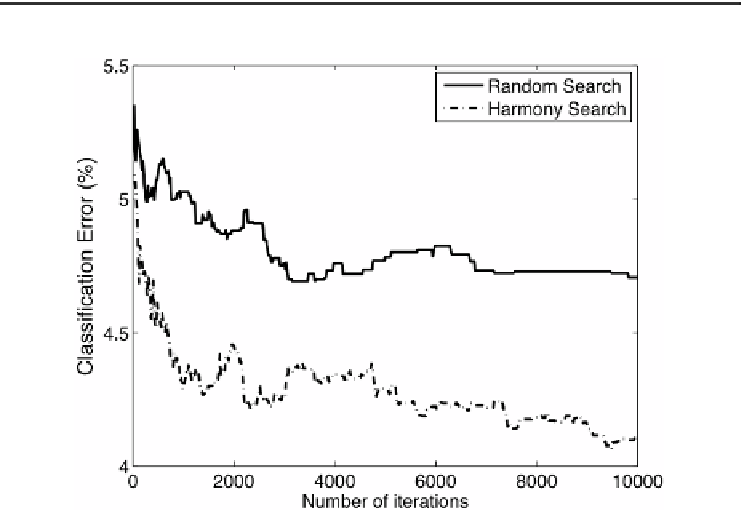
For comparative purposes, the relationships between the number of iterations and
the mean test error rate of the HS algorithm and the RS algorithms have been repre-
sented in Figure 5. Figure 5 demonstrates the best performance of the HS-based fea-
ture selection technique, which can achieve very good results with less than 1,000
iterations.
Table 2.
Validation and test classification error rates (%) for different methods
Validation error rate (%)
Test error rate (%)
Algorithms
Iterations
Mean
Std
Mean
Std
Sequential search (SS)
-
2.22
0.00
6.18
0.00
100
2.69
0.24
5.23
0.70
Random search (RS)
1,000
2.26
0.20
5.03
0.65
10,000
1.85
0.14
4.70
0.63
100
2.56
0.27
4.82
0.69
Harmony search (HS)
1,000
1.39
0.15
4.31
0.49
10,000
0.78
0.15
4.14
0.42
Fig. 5.
Relationship between the mean test error rate and the number of iterations for the ran-
dom search method and the harmony search algorithm


Search WWH ::

Custom Search