Information Technology Reference
In-Depth Information
Energy Demand Estimation (HASTEDE) models have been proposed [8] and they are
in the following structures:
()
fx
=
wX wX
+
+
wX
+
w
(2)
11
2 2
3 3
4
linear
()
fx
=
wX
w
+
wX
w
+
wX
w
+
w
(3)
6
2
4
11
3 2
5 3
7
exp
()
f x
=
wX
+
wX
+
wX
+
wXX
+
wXX
+
wX X
+
w
(4)
11
2 2
33
412
513
6 23
7
quad
where
X
1
, X
2
and
X
3
are the GDP (10
9
$), population (10
6
), and total annual veh-km
(10
9
), respectively;
(
)
W
are the corresponding weighting factors.
To minimize the sum of squared error (SSE) between the observed and estimated val-
ues, the optimization function Z is defined as:
w
∈=
i
1, 2, 3,...,
N
i
i
m
(
)
∑
2
Minimize
Z
=
TED
−
TED
(5)
actual
predicted
1
where
TED
are the actual and predicted transport energy demand,
and
m
is the number of observations.
TED
and
actual
predicted
4.1 Data for HASTEDE Models
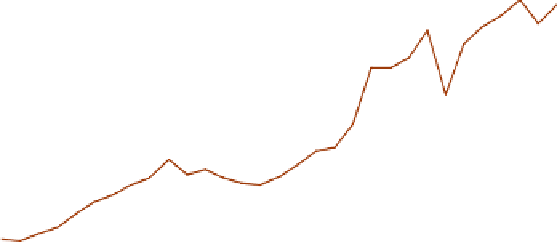
The GDP and the sectoral energy consumption (SEC) data in the following figure were
collected from the Central Bank of Turkey [40] and the WEC-TNC [12]. Observed veh-
km was taken from the GDTH [41]. The observed general trend of energy demand
GDP, population, and total veh-km between 1970 and 2005 can be seen in Figure 2.
250
SEC
GDP
Population
Total veh-km
200
150
100
50
0
Years
Fig. 2.
General trend of SEC and related parameters


Search WWH ::

Custom Search