Information Technology Reference
In-Depth Information
The corresponding
F
values for the three parameters as easily obtained as follows:
48
F
=
1
.
,
F
=
1
.
12
,
F
=
1
.
68
.
HR
PR
λ
PR
F
. Compared with the stan-
dard
F
values, it can also be conclude that the parameters are insensitive to the opti-
mization analysis.
The same values for the parameters used in OHS, NHS1, and NHS2 as used in ex-
ample 1 are adopted to compare the results obtained by the three algorithms with the
different number of slices. The results are summarized in Figure 12.
For NHS2, the values become
F
=
1
.
15
,
=
0
.
57
HR
OHS
NHS2
NHS1
30000
1.9
OHS
NHS2
NHS1
1.8
20000
1.7
1.6
10000
1.5
1.4
1.3
0
20
40
60
80
20
40
60
80
number of slices
number of slices
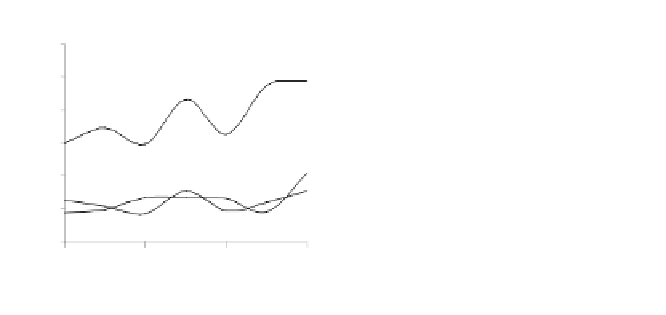
Fig. 12.
Comparison of safety factor and NEOF with different number of slices
Results in Figure 12 are basically similar to those in Figure 10. OHS tends to locate
a much higher safety factor than NHS1 and NHS2 for a given number of slices and
the results fluctuates in the range of 1.60 to 1.80 with the number of slices varying
from 20 to 80. On the other hand, the results by NHS1 and NHS2 are much more sta-
ble than OHS and the numbers of evaluation are also acceptable (most problems are
finished within 5 minutes).
5.3 Example 3
Example 3, as shown in Figure 13, is based on a problem where an irregular weak
layer is sandwiched between two strong layers. The geotechnical properties for soil
layers 1 to 3 are φ' equal to 35°, 25° and 35°; c' equal to 20 kPa, 0 kPa and 10.0 kPa;
and unit weight equals to 19.0 kN/m
3
for all the three soil layers.
The solution domain is assumed to be (
x
l
=3,
x
u
=8) and (
x
L
=20,
x
U
=28) for this ex-
ample. As described above, the orthogonal analysis is firstly performed to investigate
the sensitivity of the related parameters. The results obtained are listed in Table 4.
From the data listed in
t
5 column in Table 5, we can calculate the
F
values of
three parameters which are equal to 7.95, 14.80, and 5.32 for NHS1. According to the
comparison with the critical values
F
and
F
, it can be concluded that
HMCR
05
01
and
are sensitive and
PAR
is hyper-sensitive to the analysis. For NHS2, the corre-
sponding
F
values are 5.82 and 2.28 and
HMCR
is sensitive while
PAR
is insensitive
λ


Search WWH ::

Custom Search