Information Technology Reference
In-Depth Information
3.2 Comparison of the Identified Results
Table 1 and 2 list the results of GA [10] and HS [11]. After comparing both tables, it
can be seen that RE values decrease with the increase of the zone numbers. However,
the improvement of the RE is not significant after Ω
3
. As can be seen, HS finds better
results than GA (+ grid search + BFGS) in terms of the final RE values. Also, HS re-
quires fewer simulation runs than GA. Although the obtained transmissivities are
nearly same in Ω
1
, they are different at the others. The reason of this is related to the
differences of the identified zone structures.
Table 1.
Identified results for different zone structures using HS
Structures
RE
# of Simulations
T
1
T
2
T
3
T
4
T
5
Ω
1
275.95
3,690
208
−
−
−
−
Ω
2
60.46
12,732
281
56
−
−
−
Ω
3
2.50
23,486
585
233
58
−
−
Ω
4
2.33
29,370
499
259
218
57
−
Ω
5
2.31
33,363
541
557
284
214
56
Table 2.
Identified results for different zone structures using GA
Structures
RE
# of Simulations
T
1
T
2
T
3
T
4
T
5
Ω
1
280.11
10,000
207
−
−
−
−
Ω
2
71.60
15,000
253
46
−
−
−
Ω
3
3.55
25,000
517
228
52
−
−
Ω
4
2.62
40,000
501
299
164
54
−
Ω
5
2.61
50,000
520
279
172
48
51
80
60
(a)
(b)
70
50
60
40
50
40
30
30
20
20
10
10
0
0
1
1
2
2
HS
GA
3
HS
GA
3
4
4
5
5
Number of Zones
Number of Zones
(a) (b)
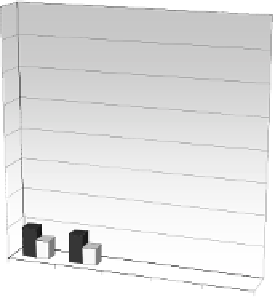
Fig. 5.
Variation of the PU values for different zone structures; (a): for the trace of the covari-
ance matrix; (b): for the norm of the covariance matrix


Search WWH ::

Custom Search